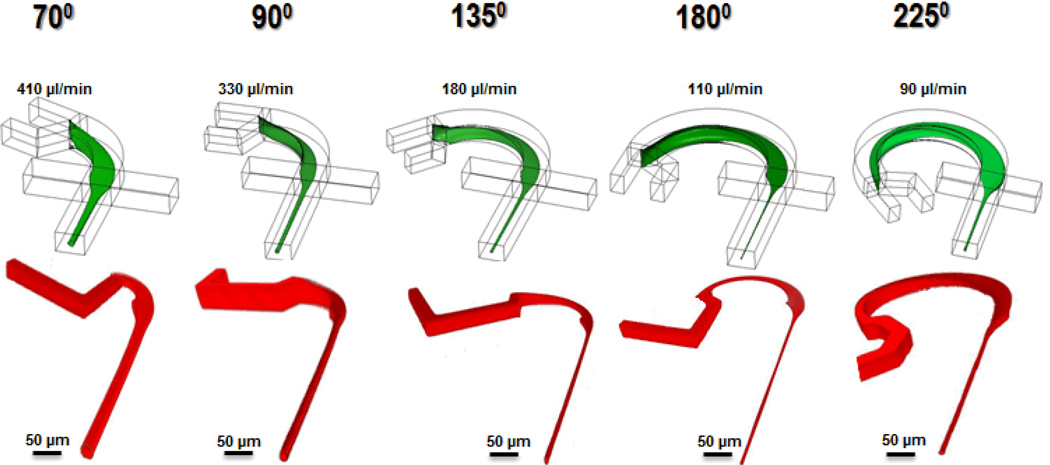
Fig. 3.
The 3D architecture of the sample flow during the “microfluidic drifting” 3D focusing process characterized by the CFD simulation (top row) and confocal microscopy (bottom row) for devices with different curvature angles (i.e., 70°, 90°, 135°, 180°, and 225°). For each device, the vertical sheath fluid rates (indicated in the figure) are optimized to achieve optimum sample-focusing performance. The CFD simulation and confocal microscopy are performed under the same flow conditions.

