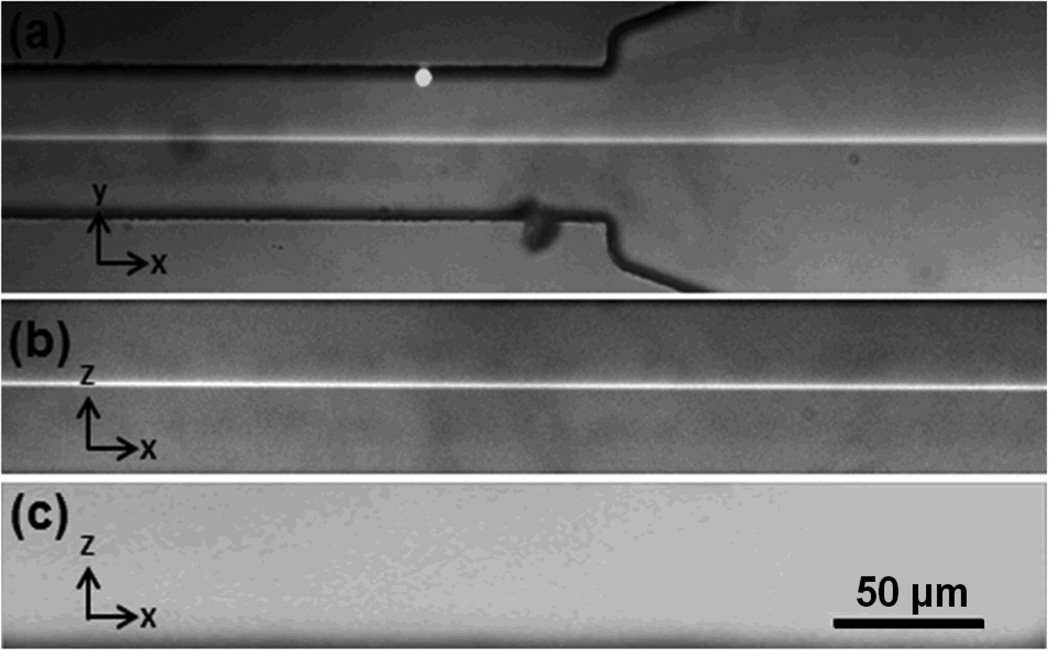
Fig. 4.
(a) Top view of the sample flow pattern during the “microfluidic drifting” 3D focusing process (5 mm downstream the exit of the 180-degree curve), indicating a focal width of ~2.5 µm. (b) Side-view of the 3D focused sample flow in the main channel, indicating a focal height of ~2.5 µm and (c) side view of the channel after the flows were stopped.

