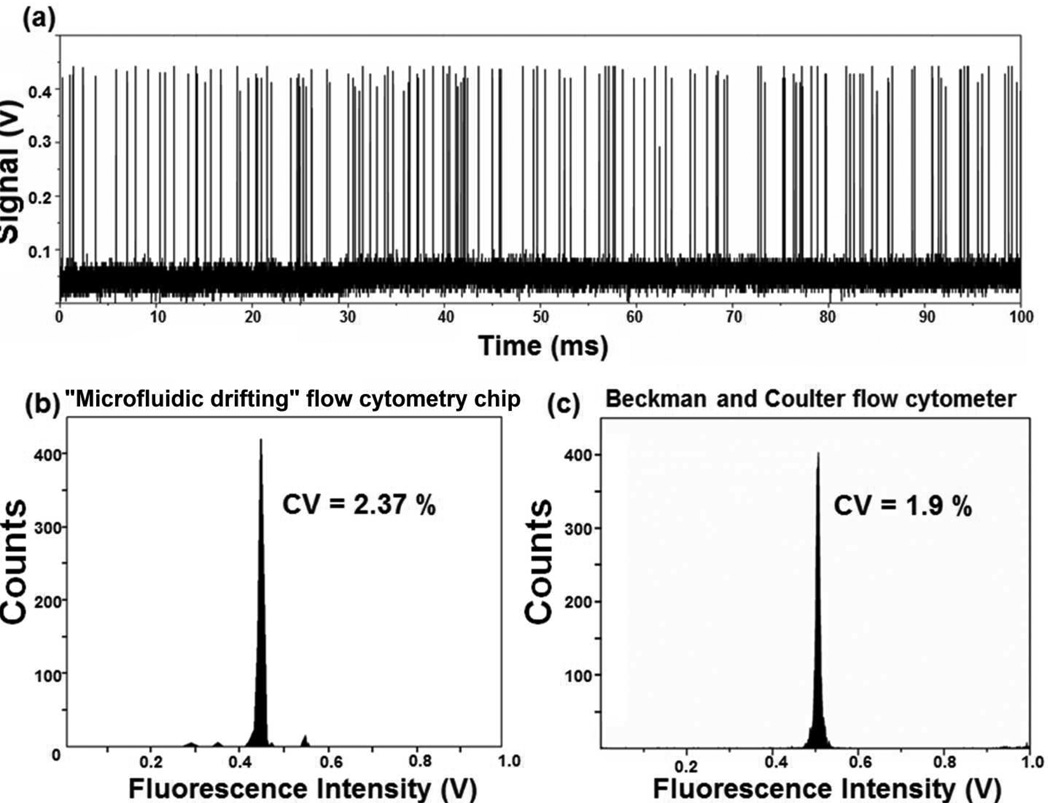
Fig. 7.
(a) A typical diagram of fluorescent peaks detected from the calibration polystyrene beads. Each peak represents a single polystyrene bead as it passed the laser interrogation region. The uniformity in the height of the peak indicates the efficacy of 3D focusing of the beads. (b) The CV results of the calibration beads indicate a single population of polystyrene beads centered at ~0.425 volts. (c) CV results of same type of polystyrene calibration beads were drawn from a Beckman and Coulter commercial flow cytometer. The population in this case centers at ~0.5 volts.

