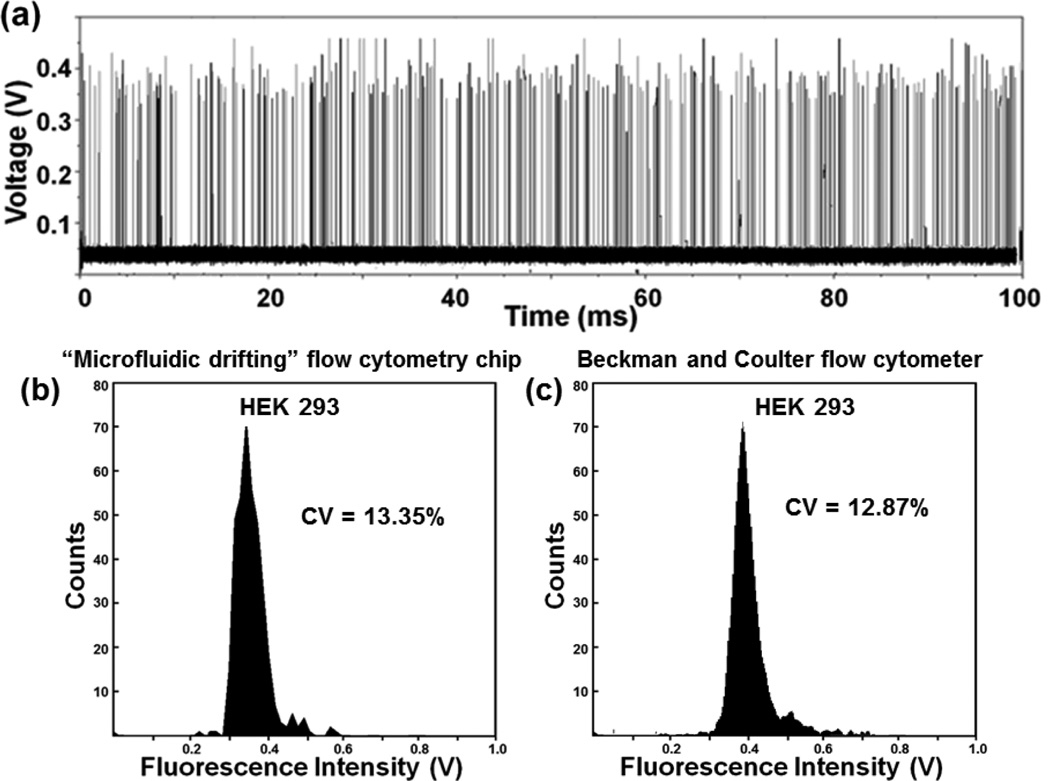
Fig. 9.
(a) A typical diagram of fluorescent peaks detected from the HEK-293 cells. (b) The plot shows a single population of HEK-293 cells. The population roughly centers at ~0.35V. The CV is calculated as 13.35 % showing the capability of our “microfluidic drifting” device to effectively focus and identify a single population of HEK 293 cells. (c) The histogram indicates a CV of 12.87% using a commercial Beckman and Coulter flow cytometer.

