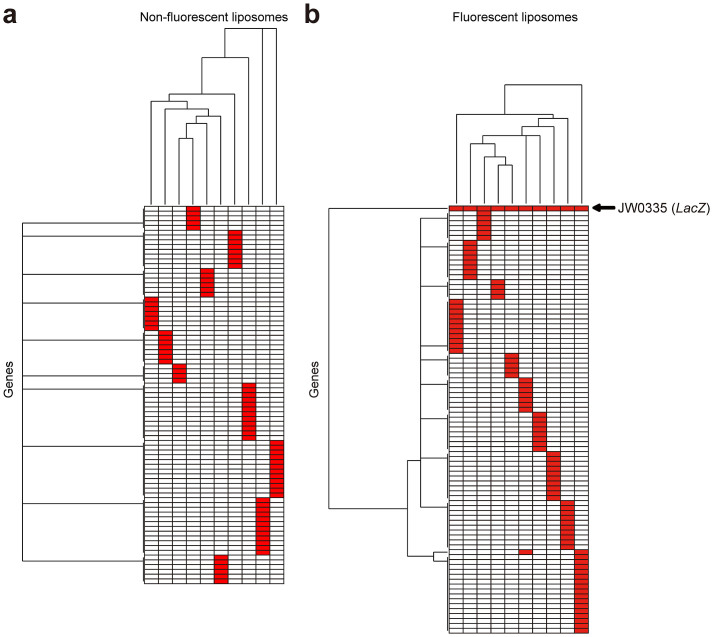
Figure 3.
(a) Hierarchical cluster analysis for genes included in non-fluorescent liposomes. Ten non-fluorescent liposomes that did not show β-galactoside hydrolysis activity were isolated, and the genes included in these liposomes were determined by multiplex next-generation sequencing using HiSeq 2500. In the hierarchical cluster analysis for these genes, there was no commonality among the genes included in each liposome, which indicated a random pattern. Each row represents a separate gene, each column represents a separate liposome and genes found in each liposome are shown in red. (b) Hierarchical cluster analysis for the genes included in fluorescent liposomes. Hierarchical cluster analysis revealed that LacZ was a clear cluster that was included in all fluorescent liposomes and with no other common factors.

