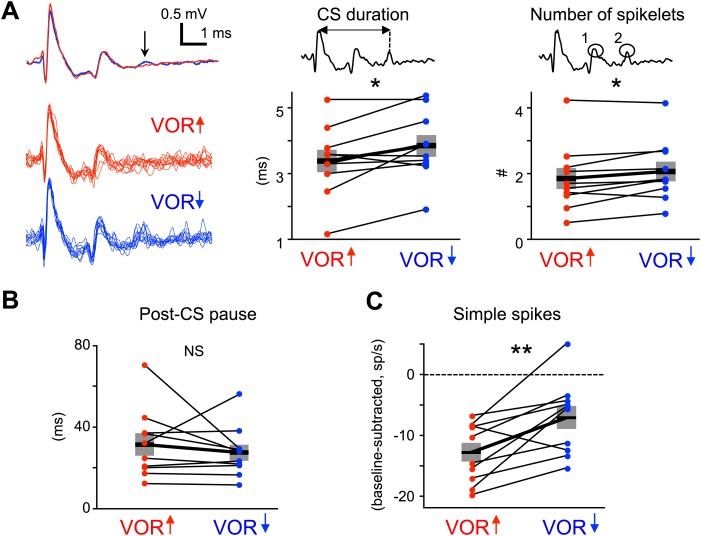
Figure 5. Measures of climbing fiber effects and circuit state during training.
(A) Complex spike waveforms during VOR-increase (red) and VOR-decrease (blue) training. Left, example cell: top, mean waveforms; bottom, overlaid individual complex spikes. Note second spikelet during VOR-decrease training. Across all cells, the complex spike waveforms were of longer duration during VOR-decrease training (center, t(9) = −2.67, *p<0.05, paired t-test) and had more spikelets (right, t(9) = −2.71, *p<0.05, paired t-test) compared to VOR-increase training. Horizontal black bars and grey rectangles indicate mean ± SEM (B) The length of the pause in simple spike firing following a complex spike was similar during VOR-increase and VOR-decrease training (NS, t(9) = 0.79, p=0.45, paired t-test). Measurements in panels A and B were made on the same complex spikes used for the trial-by-trial analysis in Figure 3. (C) Mean Purkinje cell simple spike firing (baseline subtracted, first 250 ms of trials) during stimuli in the ‘on’ direction for the climbing fibers (Figure 2E–H) was higher during VOR-decrease training (blue), than during VOR-increase training (red; t(9) = −3.39, **p<0.01, paired t-test).

