Figure 2.
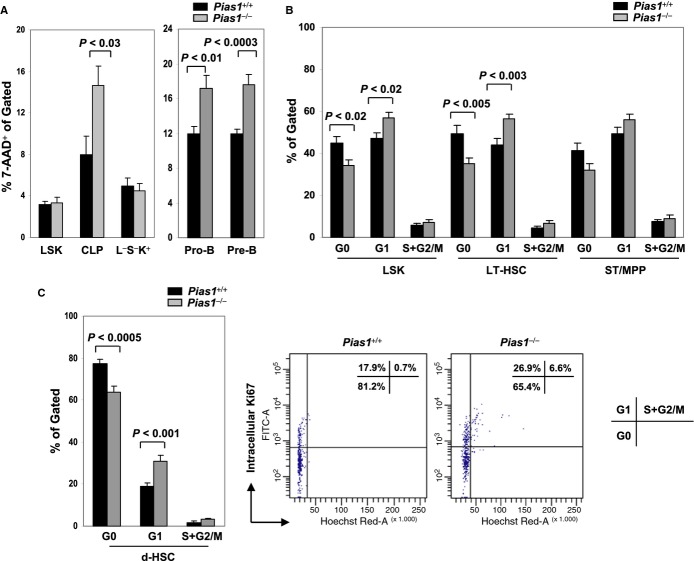
- Cell death of indicated BM subsets from Pias1−/− mice and their WT littermates (Pias1+/+) were assayed by 7-AAD staining followed by flow cytometry.
- Cell proliferation of indicated BM subsets from WT and Pias1−/− mice was revealed by intracellular Ki67 (icKi67) and Hoechst DNA staining followed by flow cytometry. G0, icKi67−, 2N DNA content; G1, icKi67+, 2N DNA content; S+G2/M, icKi67+, > 2N DNA content.
- Same as in (B) except that d-HSCs were assayed (left). A representative cell cycle profile of WT and Pias1−/− d-HSCs was also shown (right). Numbers in top right are the percentage of cells in each cell cycle.
Data information: Shown in each panel is a pool of 3 independent experiments (n = 10–13). Error bars represent SEM. P-values were determined by non-paired t-test. See also Fig S3.

