Figure 2.
Maturation of ribbon synapse ultrastructure.
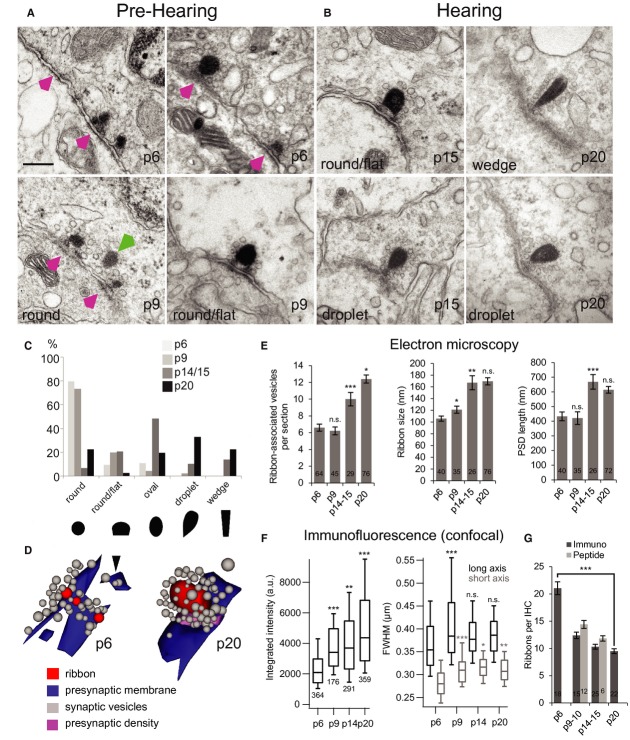
A, B Representative electron micrographs of IHC ribbon synapses in pre-hearing (A) and hearing (B) mice. Before the onset of hearing (A), at p6 and p9, multiple appositions of small discontinuous pre-and postsynaptic densities were found (magenta arrowheads) typically accompanied by one or more round-shaped ribbon(s)anchored close to the presynaptic membrane via two rootlets. In some cases ribbons were “floating” in the cytoplasm at a greater distance from the membrane (green arrowhead). After the onset of hearing (B), at p15 and p20, typically one ribbon occupied the presynaptic cytoplasm at the AZ. In comparison to before the onset of hearing, the mature pre-and postsynaptic densities were relatively extended and continuous. The sections were cut parallel to the ribbons' short axes, the perspective from which ribbon-shape was measured. Scale bar of 200 nm in (A) applies also to (B).
C Through development the ribbon-shape changed from predominantly round to oval, droplet-like, or wedge-like shapes, as shown in (A) and (B).
D 3D reconstructions from serial sections before (left, p6) and after (right, p20) the onset of hearing. Presynaptic densities connect the ribbon to the plasma membrane.
E Quantification of synaptic parameters from random EM sections. Number of ribbon-associated vesicles, size of synaptic ribbon as well as the extent of postsynaptic density (PSD) increase with age (student's t-test). Only sections parallel to the ribbons' short axes with sharply delineated PSD were analyzed. Ribbon size was measured as the length of the longest extent across the synaptic ribbon.
F Increase of ribbon size/content during development was corroborated by the increase in integrated puncta intensity from quantification of RIBEYE immunofluorescence. A developmental increase in full-width-of-half-maximum (FWHM) of Gaussian fits to puncta was also observed, Wilcoxon rank test.
G Decrease of number of synaptic ribbon during development estimated by immunohistochemistry (immuno) and live imaging (peptide), student's t-test.
Data information: *P < 0.05; **P < 0.01; ***P < 0.001. n.s., no significant difference.

