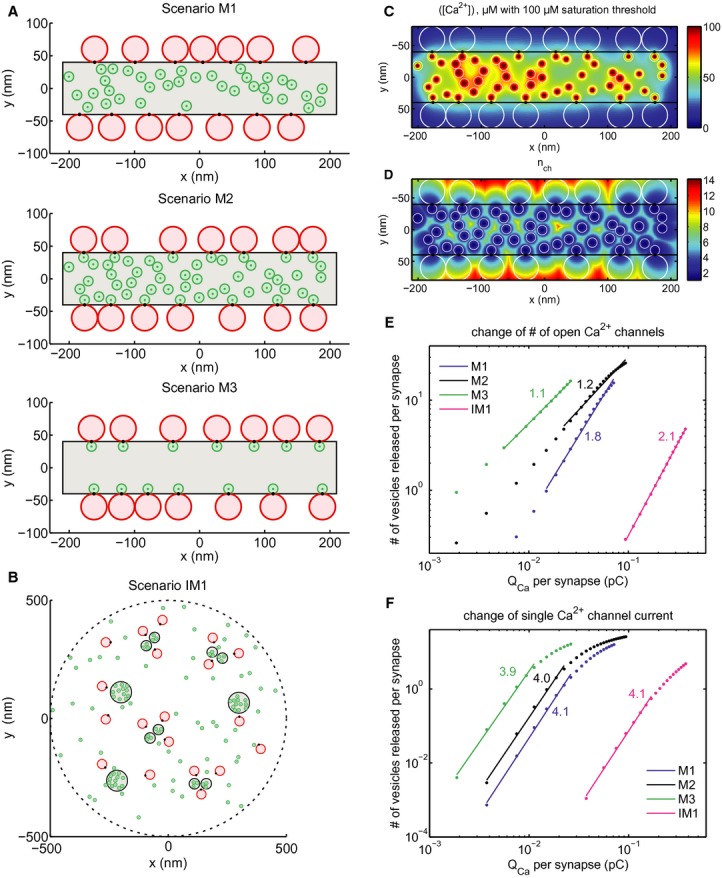
influx-exocytosis coupling: modeling.
Scenarios M1–3 of the mature AZ topography. Grey area: presynaptic density, red discs: RRP vesicles, green discs: Ca2+ channels, black spots: Ca2+ sensors of exocytosis. Scenario M1: random positioning of channels within the presynaptic density, Ca2+ sensor pointing towards the channel cluster. Scenario M2: introduction of “private channels” simulating molecular coupling of release site and channel. Scenario M3: only “private channels”, unrealistically low number of channels. Plots correspond to one out of a hundred realizations considered in the simulations.
Scenario IM1 of the immature AZ topography. Legend as in (A). Note the more extended synaptic contact with several Ca2+ channel clusters, which were placed at the sites of presynaptic densities.
Total mean steady state [Ca2+] profile at the AZ membrane for a particular realization of scenario M2.
Effective number of channels contributing to total mean steady state [Ca2+] shown in (C).
Average overall release (number of vesicles released) versus Ca2+ charge influx per synapse after the first 20 ms after the stimulus onset when NCa × Popen was changed by blocking channels (modeling the isradipine experiment). Dots correspond to the values averaged over different synapses and realizations as described in Supplementary Material S9. Straight lines are linear fits in log-log scale within the interval of fivefold decrease in QCa. Numbers correspond to the slope of fits, representing the apparent Ca2+ cooperativity of release, m. Blue—mature scenario M1, black—mature scenario M2, green—mature scenario M3, magenta—immature scenario IM1.
The same as (E) but QCa was varied by manipulating iCa instead of NCa × Popen.

