Figure 5.
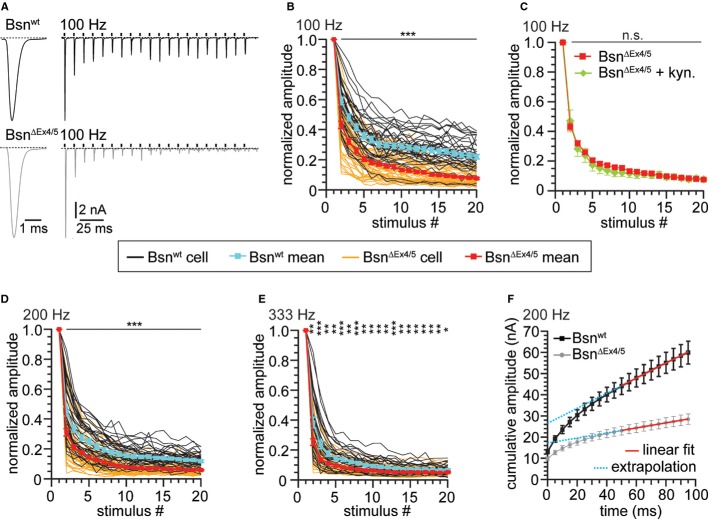
Stronger depression during high-frequency stimulation at BSNΔEx4/5 synapses.
A Example traces of EPSCs evoked at 100 Hz recorded from a Bsnwt and a BsnΔEx4/5 synapse illustrating the typical fast kinetics and short-term depression of BC EPSCs in the Bsnwt and the deeper depression in BsnΔEx4/5 synapses.
B, C Short-term depression in response to (B) 20 stimuli applied at 100 Hz (n(Bsnwt) = 38, n(BsnΔEx4/5) = 46) and (C) in the presence of 1 mM kynurenic acid [n(BsnΔEx4/5 + kyn.) = 8].
D, E Stimulation applied at (D) 200 Hz [n(Bsnwt) = 36, n(BsnΔEx4/5) = 49] and (E) 333 Hz [n(Bsnwt) = 30, n(BsnΔEx4/5) = 41]. Black traces and grey traces are mean responses from individual Bsnwt and BsnΔEx4/5 BCs, respectively. Grand means ± SEM for control synapses are depicted in cyan for Bsnwt and in red for BsnΔEx4/5 synapses.
F For estimation of the readily releasable pool size, EPSCs from trains were plotted cumulatively and a linear fit to the last ten amplitudes was extrapolated.
Data information: *P < 0.05; **P < 0.01; ***P < 0.001.

