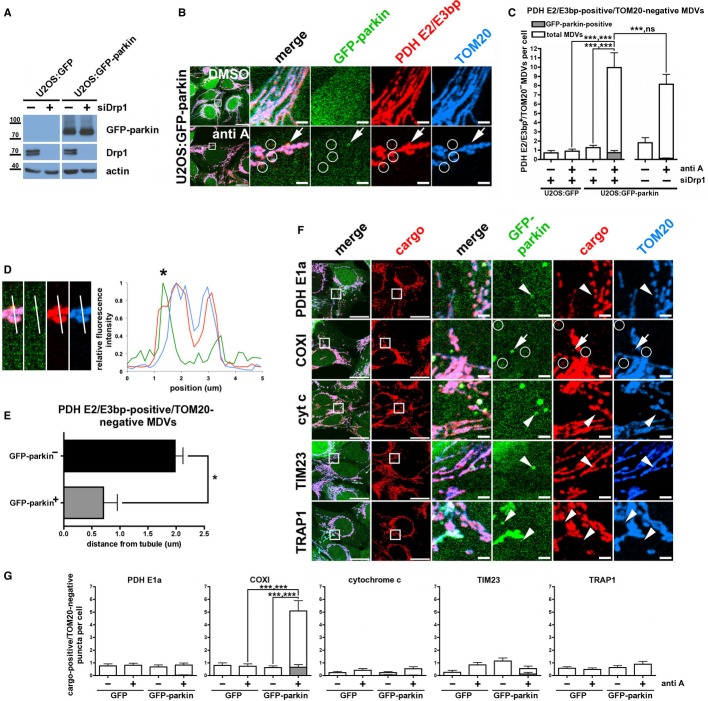
Figure 3.
- Representative immunoblot of whole-cell lysates from U2OS:GFP and U2OS:GFP-parkin cells transfected with non-targeting siRNA or siRNA targeting Drp1 (siDrp1).
- U2OS:GFP-parkin cells transfected with siRNA targeting Drp1 were treated with DMSO (upper panels) or 25 μM antimycin A (anti A, lower panels) for 90 min, then fixed and immunostained against PDH (red) and TOM20 (blue). PDH E2/E3 bp-positive/TOM20-negative MDVs colocalizing with GFP-parkin (arrows) or not (circles) are indicated. Scale bars, 20 μm (first panels on left) and 2 μm.
- Quantification of PDH-positive/TOM20-negative vesicles in U2OS:GFP and U2OS:GFP-parkin cells transfected with the indicated siRNA, treated with DMSO or antimycin A (anti A) as in (B); both the total number (white bars) and the number colocalizing with GFP-parkin (gray bars) are indicated. Bars represent the mean ± s.e.m. P-values are given first for GFP-/GFP-parkin-positive vesicles, then for total vesicle number (n = 48–85 cells in 2–3 experiments); ns, not significant; ***P < 0.001).
- 5 μm-long profile of the parkin-positive vesicle and adjacent mitochondrial tubule depicted in the antimycin A-treated cell from (B) (left). Increasing position values on the x-axis of the fluorescence intensity plot (right) correspond to moving from the top to the bottom of the profile. *MDV indicated by an arrow in (B).
- Quantification of the distance between the centres of GFP-parkin-negative (black bar) or -positive (gray bar) vesicles and the edge of the nearest mitochondrial tubule for the vesicles quantified in antimycin A-treated U2OS:GFP-parkin cells transfected with siDrp1 in (C). Error bars represent the mean ± s.e.m.; *P < 0.05 (obtained by Student's t-test).
- U2OS:GFP-parkin cells transfected with siRNA targeting Drp1 (siDrp1) were treated with 25 μM antimycin A for 90 min prior to fixation. Samples were immunostained against TOM20 (blue) and the indicated mitochondrial marker (red). TOM20-negative MDVs containing the specified cargo and colocalizing with GFP-parkin (arrows) or not (circles) are indicated. Arrowheads show lack of colocalization between GFP-parkin and the indicated mitochondrial marker. Scale bars, 20 μm (first two columns of panels) and 2 μm (remaining columns of panels).
- Quantification of TOM20-negative structures that stained positively for the indicated cargo in U2OS:GFP (GFP) and U2OS:GFP-parkin (GFP-parkin) cells, transfected with siRNA targeting Drp1, treated with antimycin A (anti A); both the total number (white bars) and the number colocalizing with GFP-parkin (gray bars) are indicated. Error bars represent the mean ± s.e.m. P-values are given first for GFP-/GFP-parkin-positive vesicles, then for total vesicle number (n = 24–59 cells in two experiments; ns, not significant; ***P < 0.001).
Source data are available online for this figure.

