Figure 5.

MYC Proteins Influence the Balance of Planar and Apico-Basal Cell Divisions in the Developing Neural Tube.
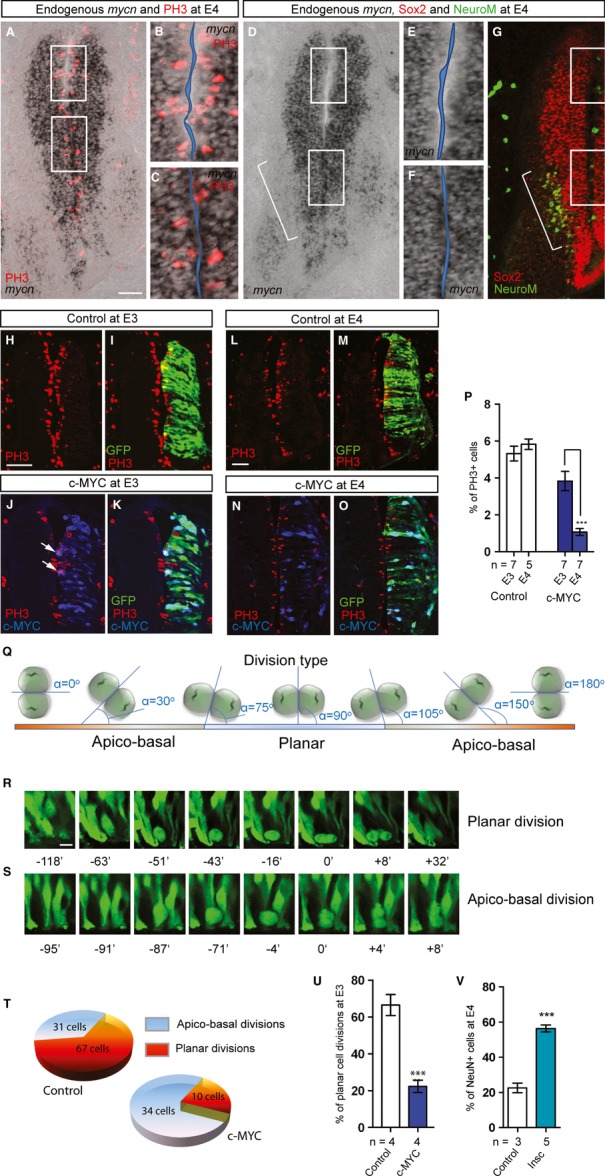
A-G Endogenous mycn levels by ISH. Dividing cells are identified using staining with an Phospho-Histone H3 (PH3) antibody (A-C). (B) and (C) show magnified dorsal and ventral regions from (A) outlined by white frames, respectively. Progenitors and intermediate neurons are identified by immunostaining against Sox2 and NeuroM on parallel sections (D-G). (E) and (F) show magnified dorsal and ventral regions from (D) outlined by white frames, respectively. Bracket marks the most neurogenic regions as defined by NeuroM expression.
H-P Overexpression of MYC eventually promotes cell cycle exit and neuronal differentiation of RGPs. Electroporation of vector control (H, I, L, M) or c-MYC (J, K, N, O) at E3 and E4. Dividing cells are identified by PH3 immunostaining; transfected cells were detected by GFP and by immunostaining for c-MYC. Scale bars, 50 μm. Quantification of the proportion of dividing PH3+;GFP+ cells in the population of targeted (GFP+) cells (% of PH3+ cells) at E3 and E4 per section is shown in (P). Data are represented as mean ± s.e.m. of n = 5–7 embryos, ***P < 0.001, t-test.
Q The threshold for defining planar versus apico-basal divisions depends on the angle α between the cleavage plane and the lumen wall of the neural tube. The ranges for angle α are set as: 75–105o for planar and 0–74o/106–180o for apico-basal divisions.
R, S Examples of planar (R) and apico-basal (S) divisions following live imaging analysis of neural tube slices electroporated with vector control or MYC constructs. The pictures are taken at different time points before and after cell division at 0 min.
T Raw data representing the total number of planar and apico-basal divisions analyzed in control (88 cells in total) and in conditions with c-MYC overexpression (44 cells in total).
U Quantification of the proportion of planar and apico-basal divisions in chick neural tube slices at E3. Data are represented as mean ± s.e.m. of n = 4 embryos, ***P < 0.001, t-test.
V Overexpression of Inscuteable results in neurogeneisis. The proportion of NeuN+;GFP+ cells in the targeted (GFP+) cells were quantified (NeuN+ cells) at E4. Data are represented as mean ± s.e.m. of n = 3–5 embryos ***P < 0.001, t-test.
