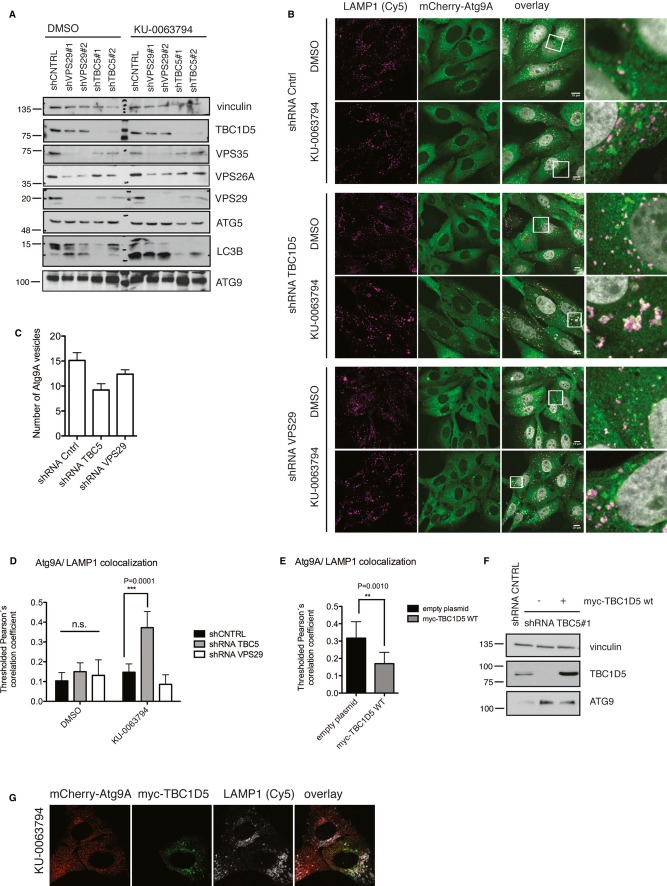
Figure 2.
- Lysates of U2OS cells stably expressing control shRNA or shRNA targeting VPS29 or TBC1D5. Cells were treated with DMSO or KU0063794 (6 h), lysed in RIPA buffer (1% SDS) and lysates were subjected to SDS–PAGE.
- U2OS cells stably expressing mCherry-ATG9 were depleted of VPS29 and TBC1D5 using shRNAs, treated with DMSO or KU0063794 (6 h), fixed with 2% PFA, and immunostained with anti-LAMP1 antibody.
- Quantification of ATG9 vesicular structures in cells from (B) under non-stimulated conditions.
- Quantification of ATG9 and LAMP1 co-localization in cells presented in (B).
- Quantification of ATG9 and LAMP1 co-localization in cells stably depleted for TBC1D5 (shRNA#1) or VPS29 (shRNA#2), transiently transfected with myc-TBC1D5 plasmid resistant to TBC1D5 shRNA#1. Cells were treated with KU0063794 (6 h), 20 h post-transfection, fixed, and immunostained with anti-LAMP1 and anti-myc antibodies.
- Control shRNA and U2OS cell lysates depleted for TBC1D5 (shRNA#1), transfected with empty plasmid or with shRNA-resistant myc-TBC1D5.
- Immunofluorescence of TBC1D5 (shRNA#1) cells transiently transfected with shRNA-resistant myc-TBC1D5, treated with KU0063794 (6 h). 20 h post-transfection cells were treated, subsequently fixed, and immunostained with anti-myc and anti-LAMP1 antibodies.
Data information: Bar graphs (C, E), mean ± s.d. n = 3, unpaired two-tailed t-test, P-values: ns P > 0.05, *P ≤ 0.05, **P ≤ 0.01, ***P ≤ 0.001. Bar graph (D), mean ± s.d. n = 3, one-way ANOVA with Bonferroni′s multiple comparison test, ns P > 0.05, *P ≤ 0.05, **P ≤ 0.01, ***P ≤ 0.001.

