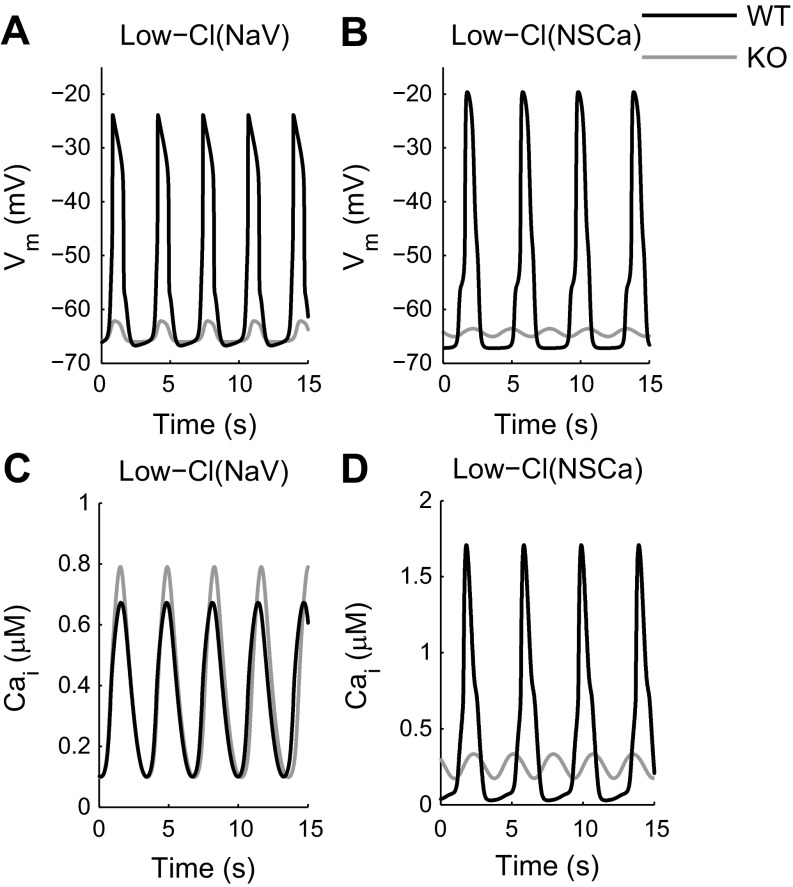
Fig. 5.
Membrane depolarizations and Ca2+ oscillations produced from model simulations with ECl set to −50 mV. The plateau current is carried by either a voltage-activated Na+ channel (A and C), or a Ca2+-activated nonselective channel (B and D). A and B: membrane potentials simulated using the WT and Ano1 KO scenarios (black and gray lines, respectively). C and D: oscillations in [Ca2+]i simulated using the WT and Ano1 KO scenarios (black and gray lines, respectively).

