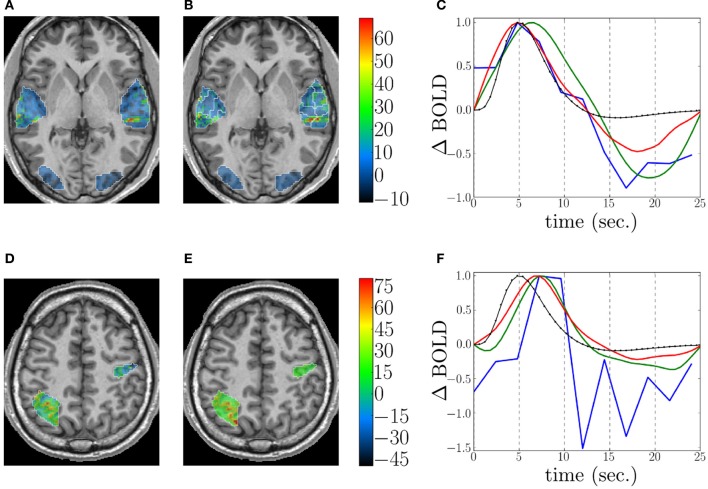
Figure 7.
Detection and estimation results on the shipped real data set. Top and bottom rows: Auditory and computation experimental conditions, respectively. Columns from left to right: Response level maps, for (A,D) GLM with canonical HRF, (B,E) JDE, superimposed with the functional parcellation (white borders). Neurological convention: left is left. (C,F): Estimation results for GLM FIR (blue), RFIR (green), and JDE (red). The canonical HRF is shown in black.

