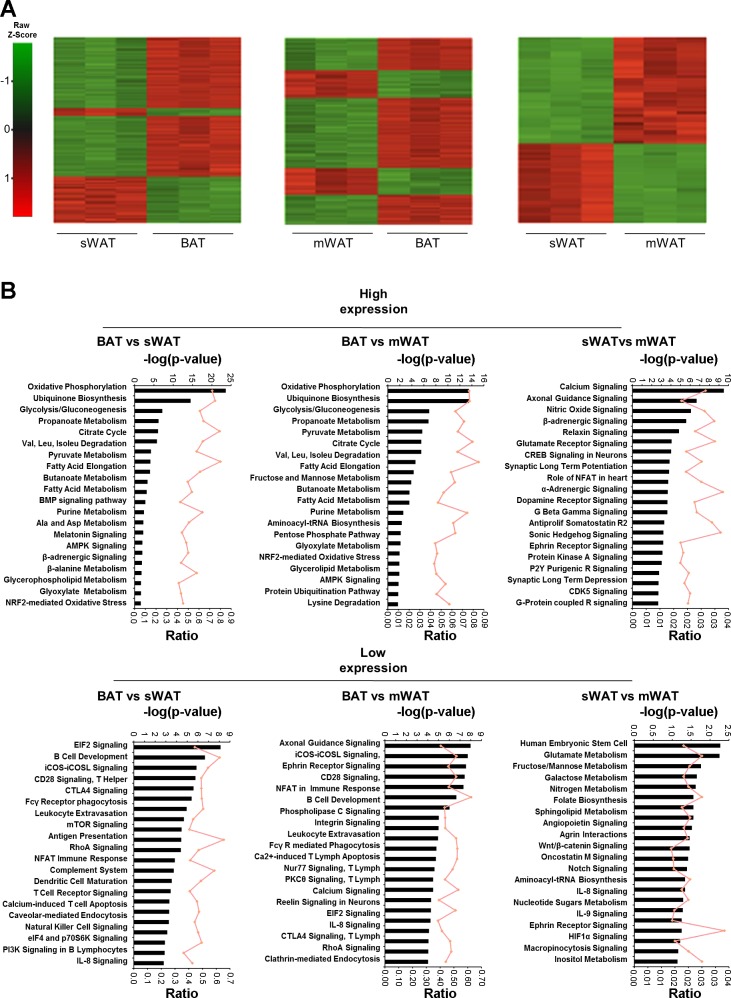
Fig. 2.
Global expression comparison of BAT and subcutaneous (sWAT) and mesenteric WAT (mWAT) at 28°C. A: global mRNA expression was measured in BAT, sWAT, and mWAT depots of mice housed at 28°C, using Affymetix 2.0 ST microarrays. Shown is a row-centred heat map of hierarchical clustering carried out on the differentially expressed gene probes at a 10% false discovery rate. Probe sets are colored according to the average expression level across all samples, with green denoting a lower expression level and red denoting a higher expression level. B: top pathways that are enriched in each of the different depots compared with each other. The bars represent significance, whereas ratio shows the genes altered out of the total genes per pathway. Pathway analysis was performed using up- and downregulated probes separately.

