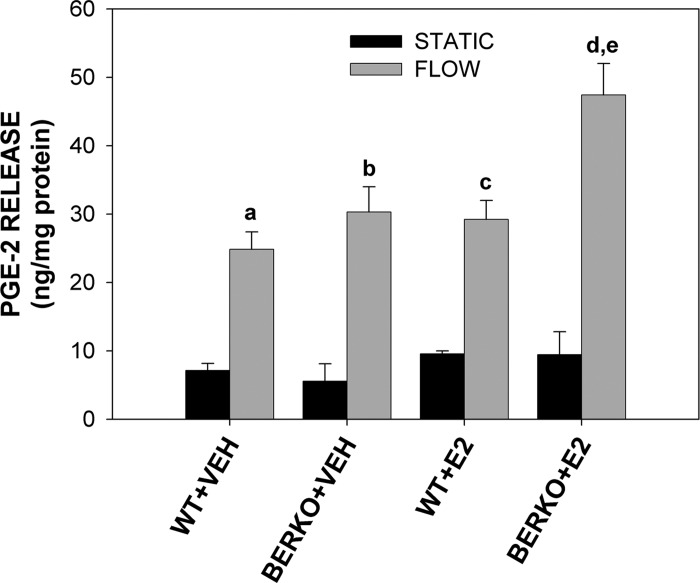
Fig. 3.
Prostaglandin E2 (PGE2) release from primary WT and BERKO calvarial osteoblasts. PGE2 release normalized to total protein in WT and BERKO cells exposed to S or 4 h of F in the absence (VEH) and presence of E2. Each group was comprised of 4–7 replicates. Bars represent means ± SE. Genotype (P < 0.05), F (P < 0.0001), E2 (P < 0.01), and genotype × F (P < 0.05) had significant main factor effects by a 3-way ANOVA. aP < 0.01 vs. WT + VEH S; bP < 0.0001 vs. BERKO + VEH S; cP < 0.001 vs. WT + E2 S; dP < 0.0001 vs. BERKO + E2; eP < 0.0001 vs. all other S and F groups by Fisher's PLSD post hoc analysis.

