Fig. 4.
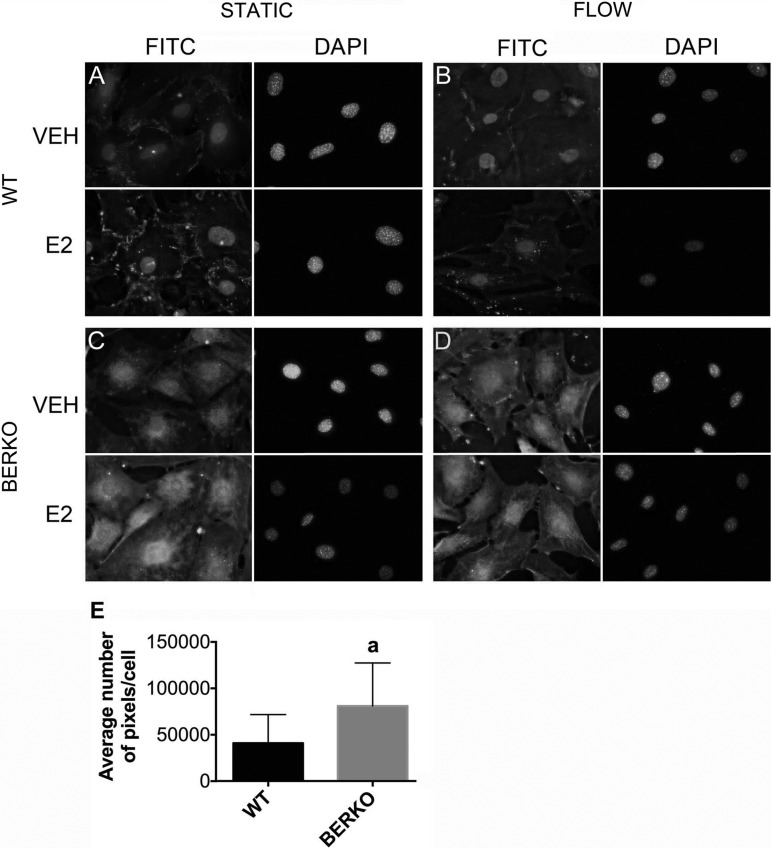
Expression of ERα in WT and BERKO primary calvarial cells exposed to static conditions or 1 h of OFF in the absence (VEH) and presence of E2. Following 1 h of OFF, cells were fixed and stained with anti-ERα antibody, FITC-conjugated secondary antibody, and DAPI for visualization of ERα localization. ERα (FITC) and DAPI images are presented side by side. A: WT cells treated with VEH or E2 and exposed to static conditions. B: WT cells treated with VEH or E2 and exposed to 1 h of OFF. C: BERKO cells treated with VEH or E2 and exposed to static conditions. D: BERKO cells treated with VEH or E2 and exposed to 1 h of OFF. Images illustrate representative ERα localization for each experimental group. Magnification, ×400. E: quantification of ERα expression in WT and BERKO cells. Expression of ERα is significantly greater in BERKO vs. WT cells by a Student t-test. aP < 0.05 vs. WT cells.

