Fig. 1.
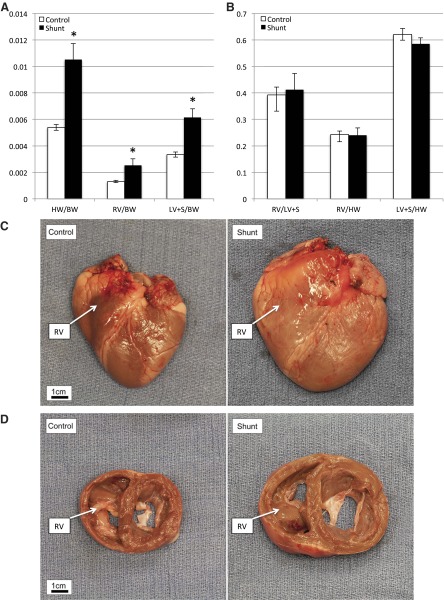
A: compared with control lambs, shunt lambs have increased total heart weight (HW)-to-body weight (BW) ratio. Both right ventricle (RV) and left ventricle plus septum (LV + S) weights are increased relative to BW. Values are means ± SD; n = 6 in each group. *P < 0.05. B: there are no differences between shunt and control lambs in the ratio of RV to LV + S weight, or RV and LV + S weight to total heart weight, suggesting no differential hypertrophic response in the RV compared with the LV. Values are means ± SD; n = 6 in each group. For C and D, control lamb BW = 10.2 kg, HW = 56.5 g; shunt lamb BW = 10.9 kg, HW = 121.4 g. RV in each panel is labeled. C: gross picture of control lamb heart (left) and shunt lamb heart. D: gross picture of 2-cm section through left and right ventricles starting at atrioventricular (AV) grove, control (left), and shunt.

