Fig. 5.
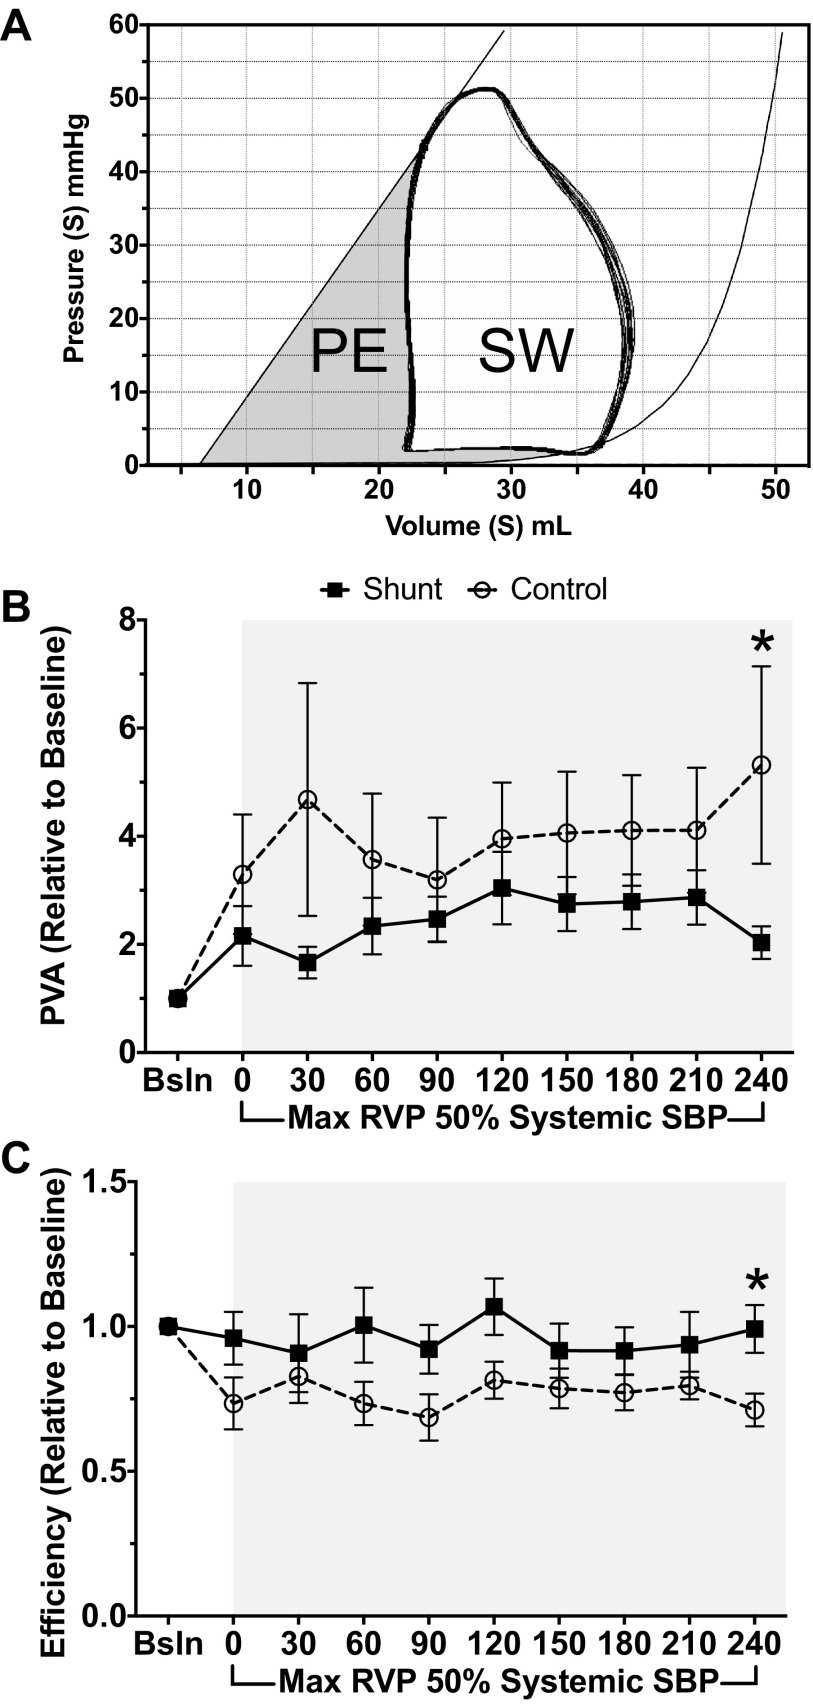
A: pressure-volume area (PVA) and ventricular efficiency demonstrated with a representative loop. PVA is represented by the total shaded area, bound by the ESPVR, end-diastolic pressure volume relations, and the systolic limb of the PV loop. PVA reflects total mechanical work of the ventricle, which includes external stroke work (SW) in the area bound by the PV loop and potential energy (PE). Ventricular efficiency is the ratio of SW to total mechanical work, or SW/PVA. B: PVA. After 240 min of PAB, PVA increases by 5.3-fold baseline in control animals, while shunt animals have a lesser increase of 2.3-fold baseline with PAB. C: ventricular efficiency. After 240 min of PAB, shunt animals maintain efficiency (0.99-fold baseline) while control animals suffer decreased efficiency (0.71-fold baseline). *P ≤ 0.05, shunt vs. control. Values are means ± SE of mean; n = 6 in each group.

