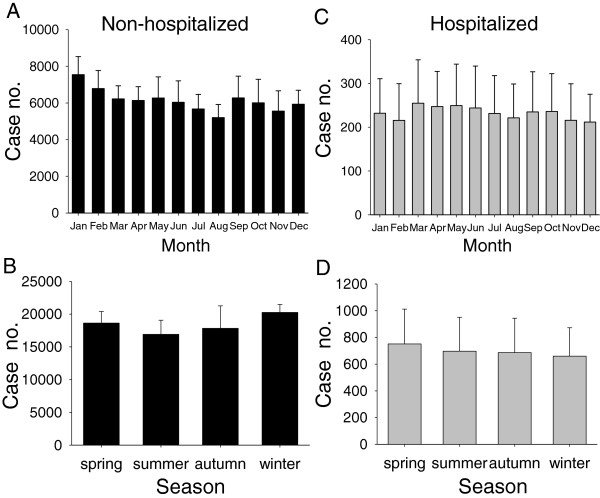
Figure 2.
Monthly and seasonal changes in children requiring emergency visits during the study period (2000-2009). Data were retrieved, corrected, and presented to be 5% of case numbers per year of all cases from the random systematic sampling database of the National Health Insurance Research Database of Taiwan. (A) Monthly and (B) seasonal changes of children not hospitalized after emergency care. (C) Monthly and (D) seasonal changes of children hospitalized after emergency care.

