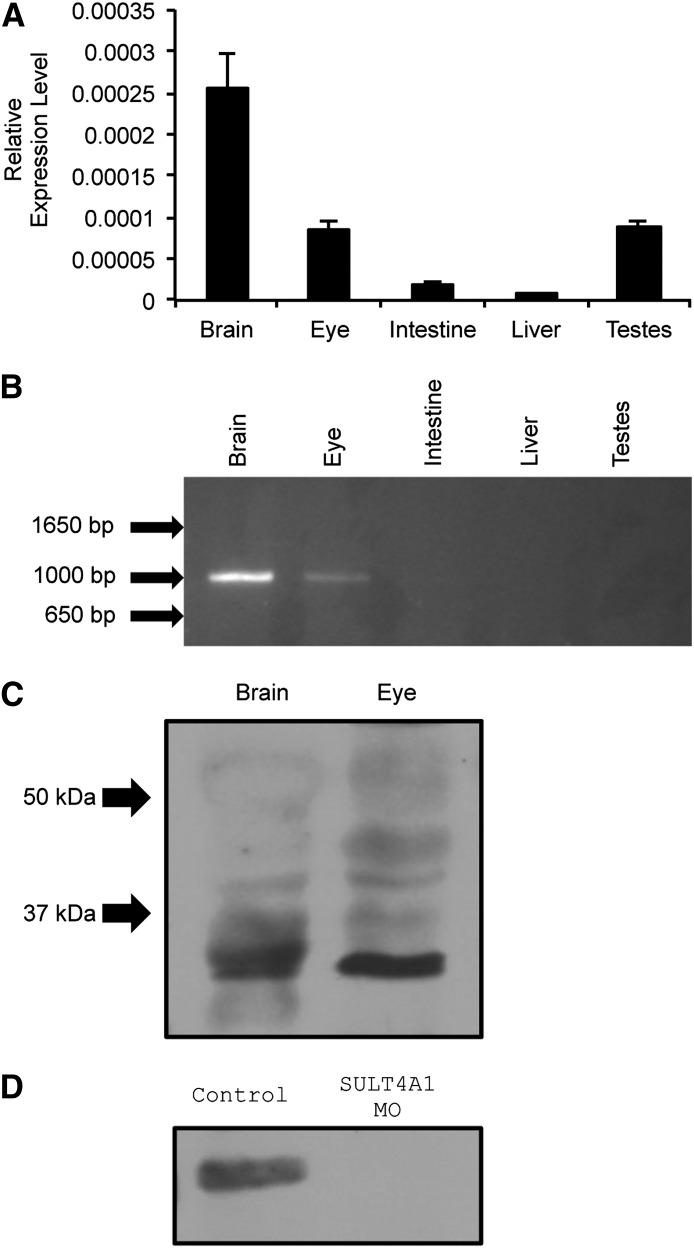
Fig. 2.
SULT4A1 expression and MO knockdown in zebrafish. (A) Quantitative real-time PCR. Relative expression levels were analyzed using the ΔCt method and normalized to endogenous expression of 18S RNA. Error bars indicate standard error of the mean. Brain (2.54e−4 +/− 4.24e−5); eye (8.45e−5 +/− 1.01e−5); intestine (1.75e−5 +/− 5.35e−6); liver (7.7e−6 +/− 1.48e−6); and testes (8.69e−5 +/− 8.09e−6). (B) Qualitative PCR of SULT4A1 message in adult AB zebrafish brain, eye, intestine, liver, and testes using full-length primers (forward: 5′-atggcggaaagcgaggtgga-3′; reverse: 5′-ctgctttacaggataaagtc-3′). (C) Immunoblot of zebrafish brain and eye lysate using anti-human SULT4A1 polyclonal antibody. Each lane was loaded with 396-µg lysate. Arrows indicate molecular weight. (D) Immunoblot of SULT4A1 in control and knockdown embryos at 72 hpf using an anti-human SULT4A1 polyclonal antibody. Each lane was loaded with 173 µg.

