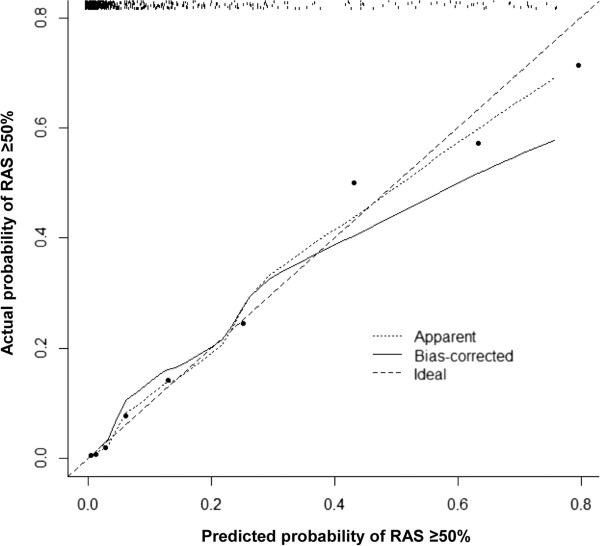
Figure 4.
Calibration plot for the model for predicting RAS ≥50%. The plot illustrates the accuracy of the best-fit model (“Apparent”) and the bootstrap model (“Bias-corrected”) for predicting RAS ≥50%. Locally weighted scatterplot smoothing was used to illustrate the relationships of the two models with the ideal line. Both plots are slightly non-linear and agree well in low predicted probabilities of RAS ≥50%, but the disagreement between the two plots grows with the predicted probability of RAS ≥50%. The 0.9 quantile absolute error of the predicted probability is 0.047. The black dots illustrate the relationship between the predicted probability and observed probability of the scoring system for predicting RAS ≥50% in the original data set. The r2 of linear regression of the dots is 0.982.

