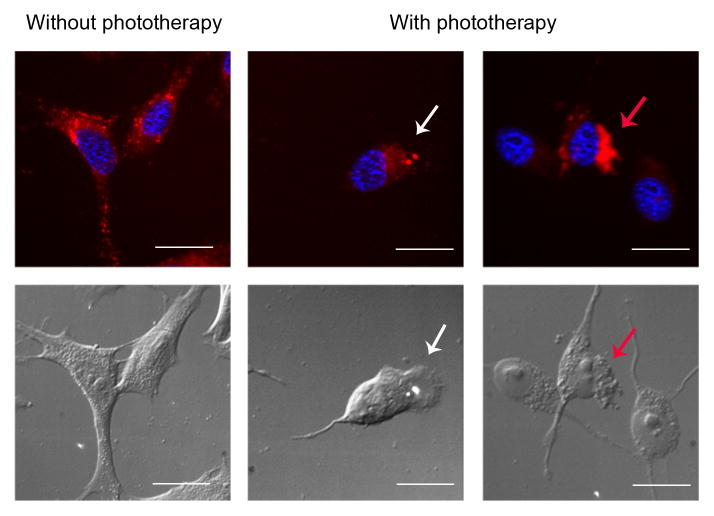
Figure 4. Fluorescence microscopy of CB2-mid DBT cells with or without phototherapy.
CB2-mid DBT cells were treated with 5 μM of IR700DX-mbc94 at 37 °C overnight, with or without light irradiation (30 mW/cm2, 20 min). Upper panel: IR700DX-mbc94 (red fluorescence) and DAPI (blue fluorescence) images. Lower panel: Differential Interference Contrast (DIC) images. With phototherapy treatment, cells experienced typical necrotic cell morphological changes, such as bleb formation (white arrowhead), cell membrane rupture and releasing of cells’ contents (red arrowhead). Scale: 20 μm.

