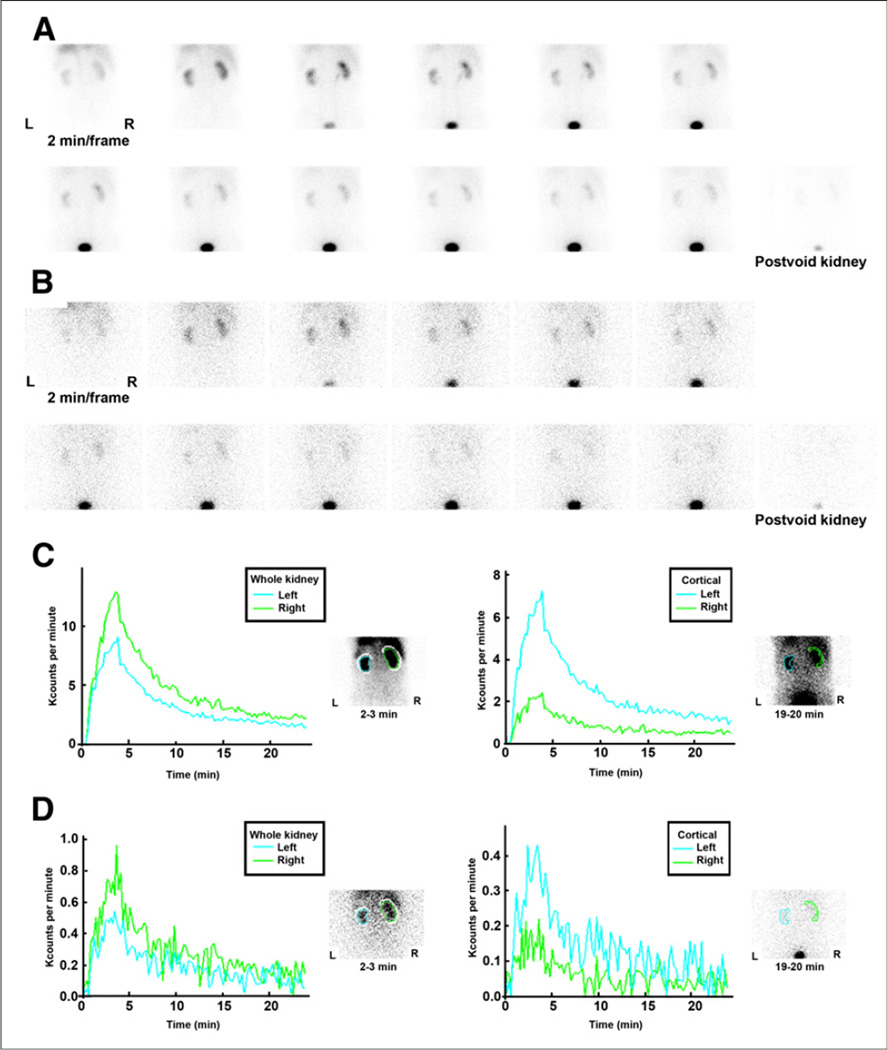
FIGURE 3.
Two-minute kidney images after simultaneous injection of 95.8 MBq (2.59 mCi) of 99mTc(CO)3(NTA) (A) and 11.8 MBq (0.32 mCi) of 131I-OIH (B) in 74-y-old man with stage 3 chronic kidney disease. Whole-kidney and cortical (parenchymal) renogram curves are displayed in C for 99mTc (CO)3(NTA) and in D for 131I-OIH. Renogram curves for 131I-OIH are quite noisy because of relatively low counting rate resulting from lower administered dose, poor capture of 364-keV photon of 131I by 9.5-mm (3/8-in) crystal, and high-energy collimator not optimized for 131I.

