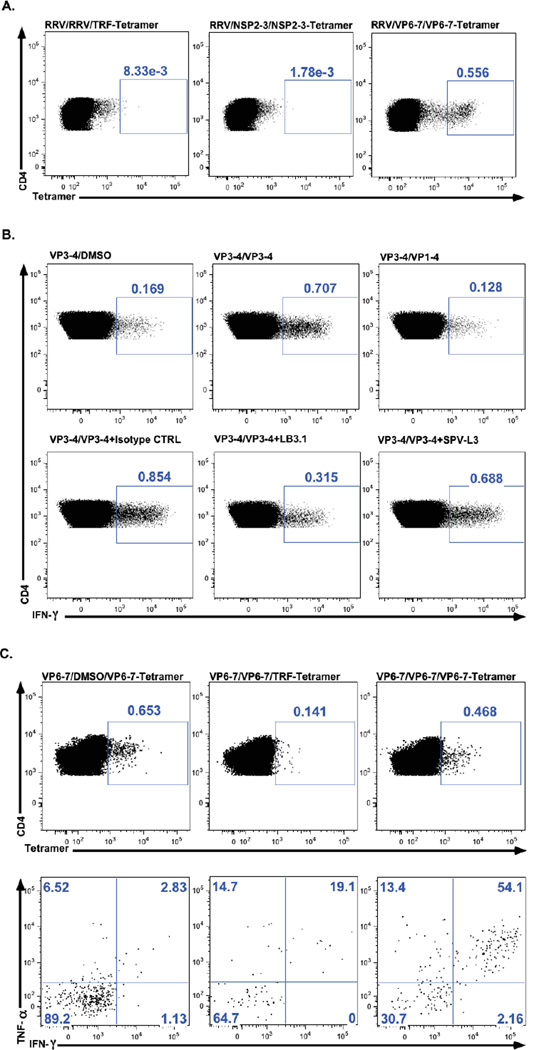
Fig. 3. Response of RRV and peptide specific T cell lines.
(A) A RRV-T cell line was obtained from a healthy adult (HA-02), then restimulated with RRV, NSP2-3, VP3-4 or VP6-7, and finally stained with the TFR-tetramer or the corresponding RV-tetramers. Left panel: RRV-T cell line restimulated with RRV and stained with the TRF-tetramer. Middle panel: RRV-T cell line restimulated with NSP2-3 peptide and stained with the NSP2-3-tetramer. Right panel: RRV-T cell line restimulated with VP6-7 peptide and stained with the VP6-7-tetramer. This T cell line only recognizes the VP6-7 tetramer. (B). A VP3-4 specific T cell line from HA-02 was restimulated with DMSO (upper left panel), VP1-4 as a control peptide (upper right panel), or VP3-4 in the absence (upper center panel) or in the presence of an isotype control antibody (lower left panel), LB3.1 (lower center panel), or SPV-L3 (lower right panel) antibodies, which are directed against HLA-DR or HLA-DQ molecules, respectively, and the frequencies of cells producing IFN-γ were evaluated by intracellular cytokine staining. (C) A VP6-7 specific T cell line from HA-02 was stimulated with DMSO (left panels) or VP6-7 (middle and right panels) for 6h at 37°C and stained with the VP6-7-tetramer (upper right and left panels) or TRF-tetramer (upper center panels). Tetramer+ cells were evaluated by ICS for TNF-α and IFN-γ production (lower panels). Numbers inside all graphics represent percentages of populations. Responses were considered positive if the frecuency of TNF-α and/or IFN-γ-producing CD4 T cells was at least twice that of the DMSO control stimulated cells.

