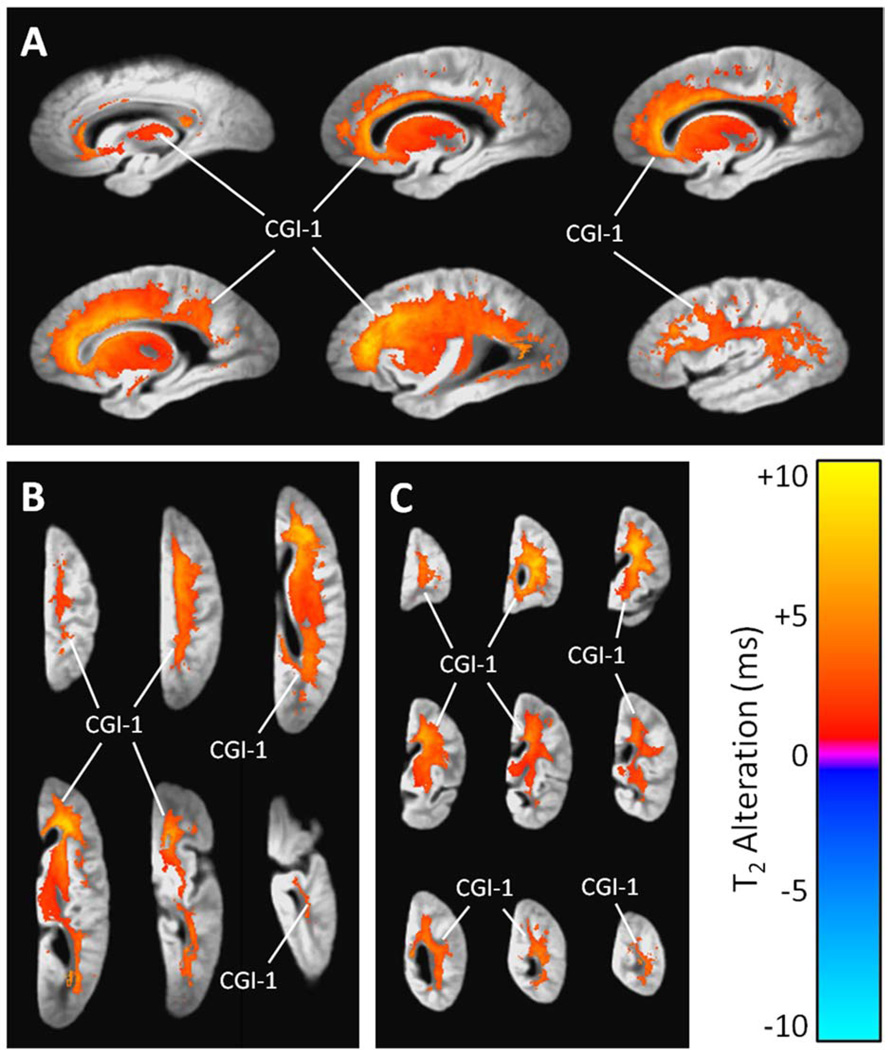
Figure 3.
(A) Sagittal, (B) axial, and (C) coronal views showing regions of significant T2 prolongation and T2 shortening associated with the number of chronic gross infarcts per cerebral hemisphere, according to a combined linear regression analysis that simultaneously considered AD pathology, acute and chronic gross infarcts, and hippocampal sclerosis (and covariates). The grayscale underlay is the study-specific template (proton density-weighted). Alphanumeric labels are those cluster identifiers introduced in Table 3.

