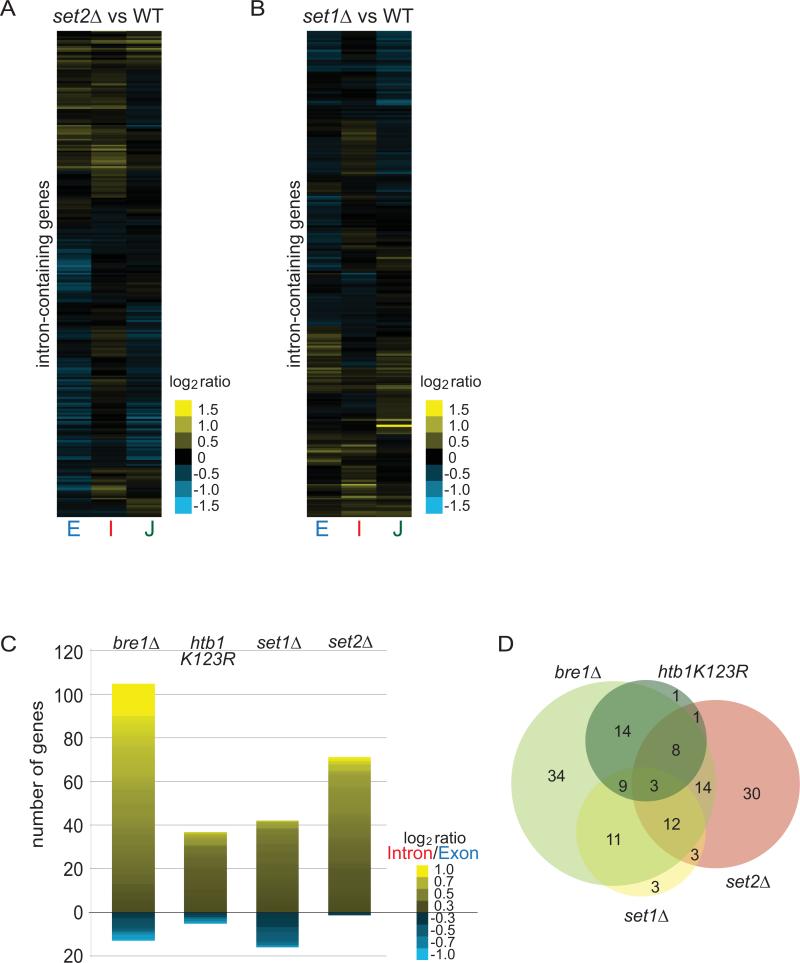
Figure 2. Defects in Ub-H2B, H3K4me, H3K36me cause introns to accumulate for distinct subsets of transcripts.
(A, B) Heat maps of log2 ratios of each gene feature in set2Δ or set1Δ strains compared to isogenic WT strains after a 3-hour shift to 39°C. Gene order is different for each sub-panel. (C) Histogram of number of genes exhibiting log2 (Intron/Exon) ratio greater than 0.3 or less than -0.3. Heat map within bar shows degree of splicing change of those genes. (D) Venn diagram of genes from histograms for comparison of each genotype directly. Note: set1Δ and htb1K123R have 1 gene overlap which cannot be shown. The circle sizes are representative of the numbers of genes with log2I/E>0.3 but the overlaps are not to scale.

