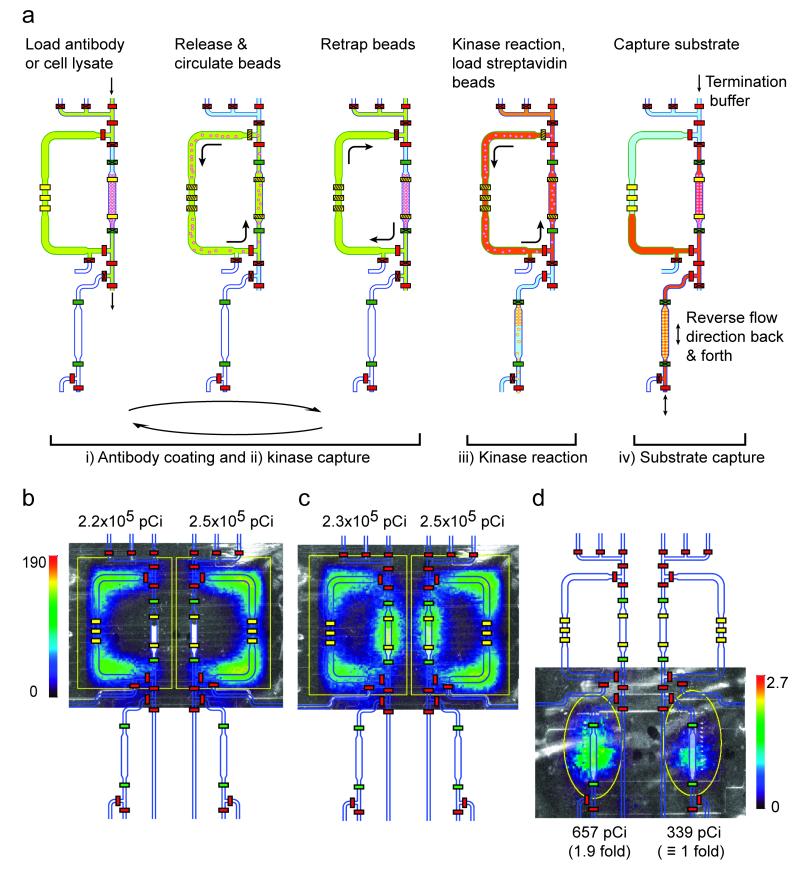
Figure 2. Schematic diagrams of key steps of the operation of the on-chip kinase radio assay.
(a) Roman numerals correspond to the steps in Figure 1d. (steps i-ii) Loading anti-kinase antibody solution or cell lysate into the circulation chamber (370 nL volume). Releasing protein-G beads (6.7 μm diameter, polystyrene) into the circulation chamber for antibody coating (30 min at room temperature (RT)) (step i) or kinase capture (30 min, RT) (step ii); the solution and beads are circulated around the upper chamber driven by two serial sets of peristaltic pump valves. The hatch lines on the yellow pump valves indicate an active pumping mechanism. The pumping direction is reversed every 80 sec to prevent bead clumping. Re-trapping beads in the capture column of the upper circulation chamber between steps (5 min) to allow for bead washing and solution exchange in the circulation chamber. (step iii) Kinase reaction with solution and bead circulation in the upper chamber (15 min, RT). The operational steps here are the same as in steps i-ii, except that while waiting for the kinase reaction to finish, the streptavidin polystyrene (PS) beads are independently loaded into the lower column (80 nL volume) from below. (step iv) Capturing and washing the labeled (and unlabeled) peptide substrate in the lower streptavidin bead substrate-capture column using a flow reversal protocol, prior to washing away any unincorporated radioisotope (32P-ATP) and using the beta camera (PSAPD) for imaging and quantitation. Different channel colors represent different loaded solutions. (b-d) Mid-experiment monitoring of device and assay performance and final signal quantitation using the beta camera. Overlaid images of the CCD camera optical image, the false color beta camera radioactivity image, and the chip AutoCAD drawing during various assay steps: (b-c) loaded radioactive (32P-ATP) kinase reaction buffer prior to (b) and after (c) circulation demonstrating equal loading, and (d) the final captured radiolabeled peptide substrate in the lower column showing the anticipated 2-fold difference in kinase activity between 6,000 and 3,000 Ba/F3 + BCR-ABL cells. The color bars represent the beta camera image scales in counts per second per mm2. Total detected activity (pCi) for each ROI (region of interest, yellow outline) is indicated. See Supplemental Methods for how the ROI was chosen.

