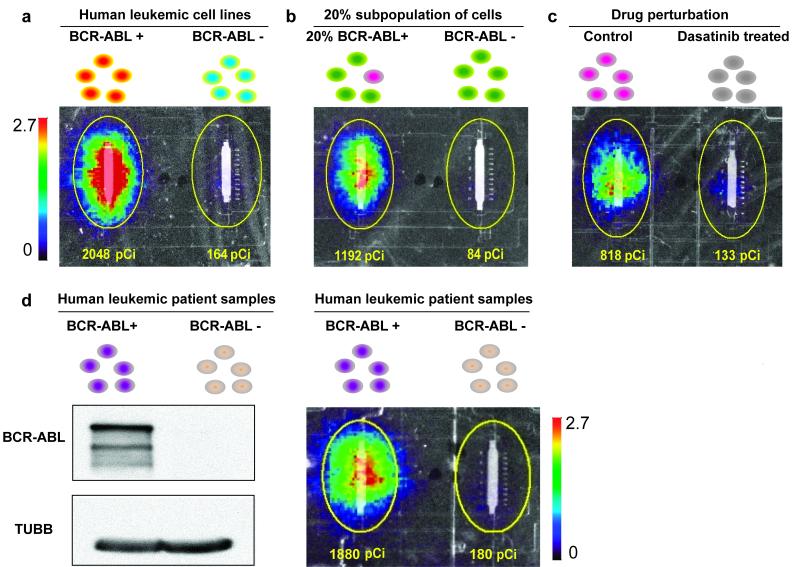
Figure 4. On-chip in vitro BCR-ABL kinase radio assays in leukemic systems.
(a) Detection of BCR-ABL activity from BCR-ABL expressing human cell lines. The on-chip in vitro BCR-ABL kinase radio assay was performed on lysates from the human leukemic cell line K562 (with leukemia patient derived BCR-ABL expression) and U937 (with no BCR-ABL expression). (b) Qualitative detection of BCR-ABL activity from a subpopulation of BCR-ABL expressing cells as a model for heterogeneous patient samples. BCR-ABL activity was detected from a 1 in 5 subpopulation of BCR-ABL expressing cells (4,500 Ba/F3 + BCR-ABL : 18,000 Ba/F3 cells versus 22,500 Ba/F3 cells). (c) Detection of sensitivity to BCR-ABL-targeted drug inhibition. Ba/F3 + BCR-ABL (p210) cells were treated with 125nM dasatinib or DMSO solvent alone (control) for 2 h and then BCR-ABL kinase activity was measured in the microfluidic platform (4,500 cell input). (d) Detection of BCR-ABL activity from Ph+ leukemic patient samples in a mouse xenograft system. Mouse spleens with more than 95% hCD45 Ph+ cells or more than 90% hCD45 Ph− cells were harvested, lysed and analyzed by anti-c-ABL immunoprecipitation and immunoblotting and anti-TUBB immunoblotting (left) and by the on-chip in vitro BCR-ABL kinase radio assay (4,500 cell input) (right). All results are represented by overlays of optical images of the lower substrate capture columns and beta camera false color images (20 min acquisition). The color bar scale (counts per second per mm2) and total detected activity (pCi) for each ROI (region of interest, yellow circle) are indicated. The size of the ROI is uniform across all experiments.

