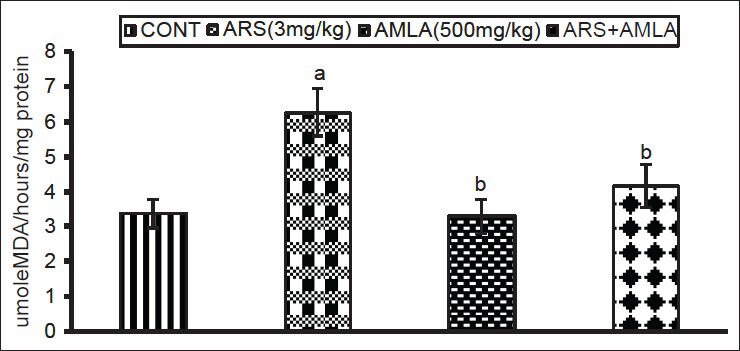
Figure 3.

Effect of host treatments on lipid peroxidation levels in splenocytes. Values shown are mean (±SEM) of 5 mice/group. Groups (left to right): control, arsenic only (3 mg/kg), amla only (500 mg/kg) and co-treatment with arsenic and amla. (a) Value significantly differs from control and (b) from arsenic only group (P < 0.05)
