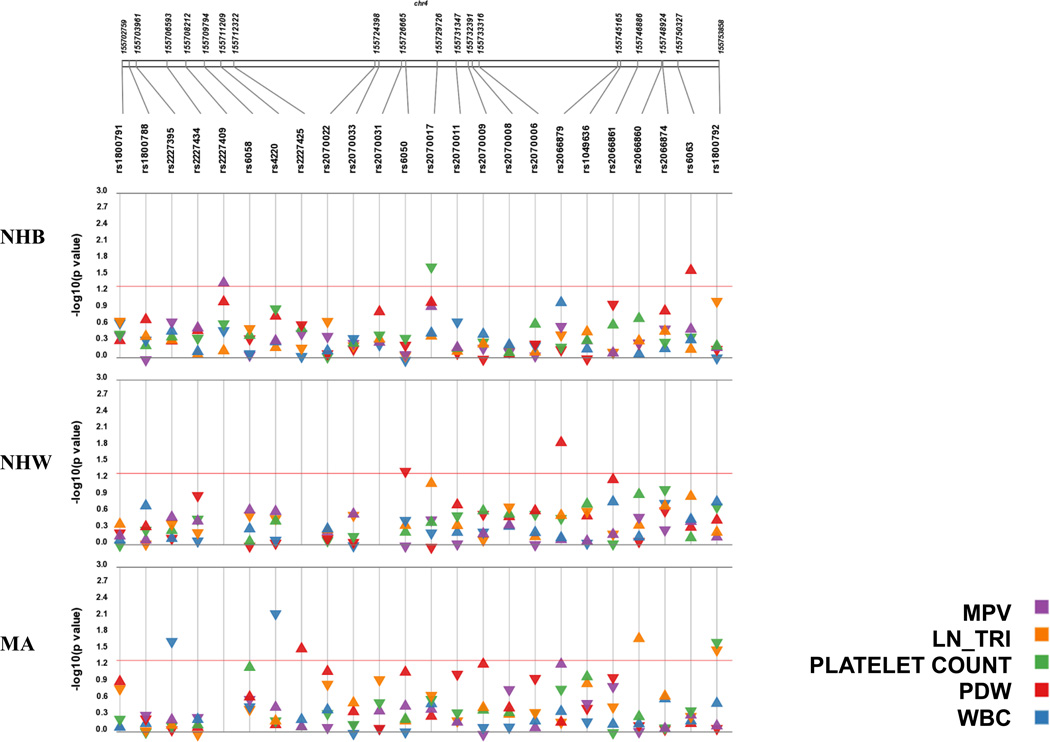
Figure 2. Synthesis view plot comparing significant results from tests of association for five hematological traits across three NHANES subpopulations.
The –log10 of the p-value and the direction of the effect (indicated by arrow direction) are on the y-axis and SNPs are located on the x-axis. Each panel represents a different population from the NHANES III dataset and each colour represents the haematological traits tested for each SNP. Points above the red line represent a significant association (p<0.05). Abbreviations: non-Hispanic black (NHB), non-Hispanic white (NHW), Mexican American (MA), mean platelet volume (MPV), transformed triglycerides (ln_TRI), white blood cell count (WBC), and platelet distribution width (PDW).

