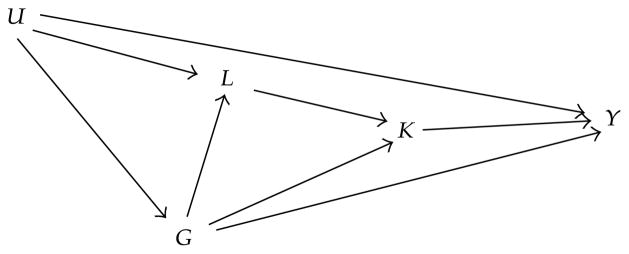
Figure 1.

Causal diagram showing potential confounding mechanisms for the association between the genotype of a genetic marker G and the phenotype Y. The variable K denotes the intermediate phenotype, L the collection of known environmental and genetic risk factors, and U the unknown environmental and genetic risk factors such as population stratification and unknown genetic variants in linkage disequilibrium with G.
