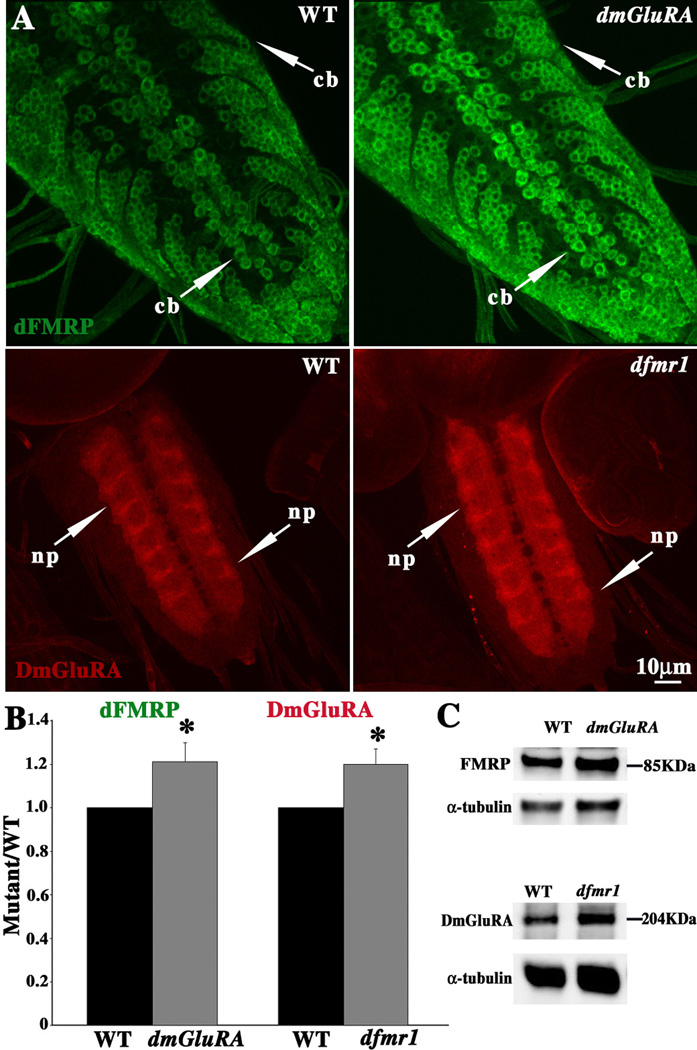
Figure 1. DmGluRA and dFMRP display mutual negative regulation.
A. Representative images of dFMRP (green) and DmGluRA (red) expression patterns in third instar larval CNS in wildtype (WT), dfmr1 null mutant, and dmGluRA null mutant. Both dFMRP and DmGluRA are highly enriched in CNS neurons, with dFMRP primary localized in neuronal cell bodies (cb), and DmGluRA primary localized in synaptic neuropil (np). Expression was assayed for each protein in the respective opposing null mutant. dFMRP level is clearly increased in dmGluRA null mutants, and DmGluRA level is also increased in dfmr1 null mutants. The scale bar is 10µm. B. Fluorescence intensity quantification of dFMRP and DmGluRA expression from (A). See Methods for detailed description of quantification method. C. Representative Western Blots showing dFMRP and DmGluRA expression compared to an α-tubulin loading control. The dFMRP level increases in the dmGluRA null, and DmGluRA expression increases in the dfmr1 null.

