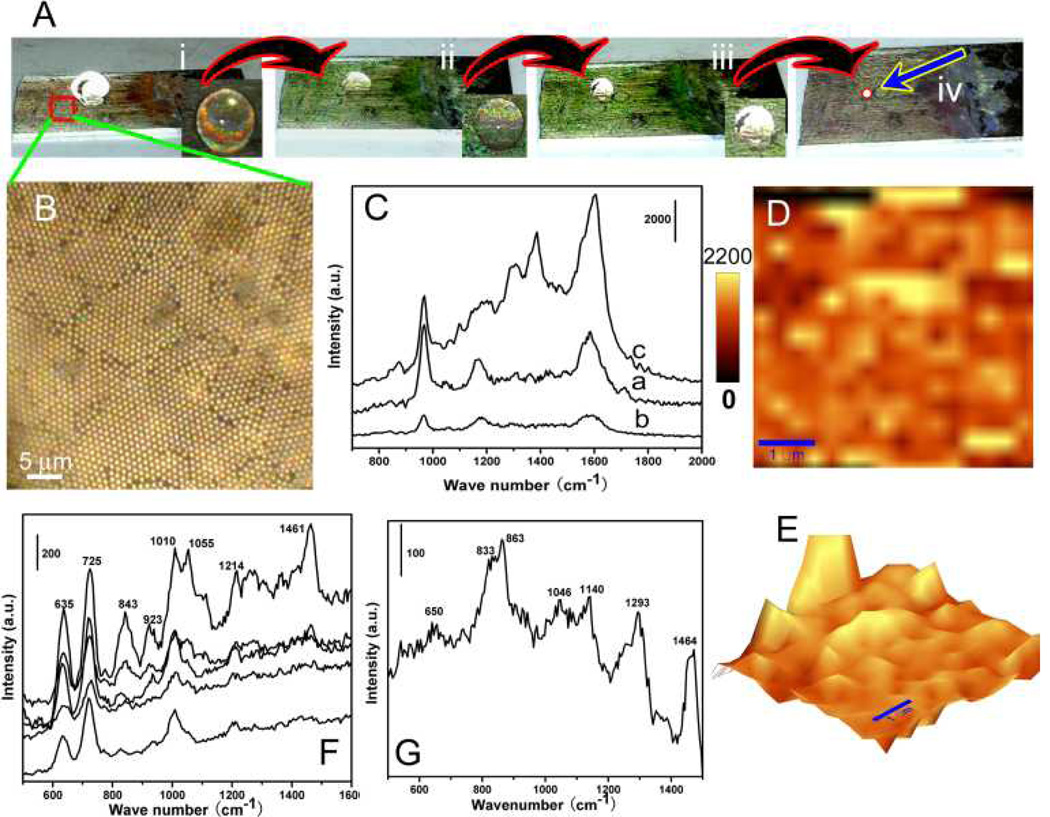
Fig. 4.
(A) Experimental results of the superhydrophobic surface-enabled enrichment of analyte molecules. (i) as 10 µl of R6G solution with a concentration of 1 fM was put on the PS-Ag Janus particle array. (ii) after solvent evaporation of 50 mins, (iii) 70 mins, and (iv) 90 mins. After 90-min solvent evaporation, R6G molecules were delivered to a localized area. (B) Optical image of the SSERS substrate. (C) SERS spectra of R6G. Curves a and b are related to SERS spectrum obtained from R6G solutions with concentrations of 10 nM and 1 pM. Curve c is SERS spectrum using the SSERS concept with a starting concentration of 1 fM. (D) and (E) Normal and three-dimensional SERS mapping results of R6G molecules with an integration time of 1 s. Scale bar in (D) and (E) is 1 µm. (F) and (G) Raman spectra of 1 nM protein (PV RdRp) and 1 fM virus (poliovirus type I Sabin) acquired by taking advantage of the SSERS concept.

