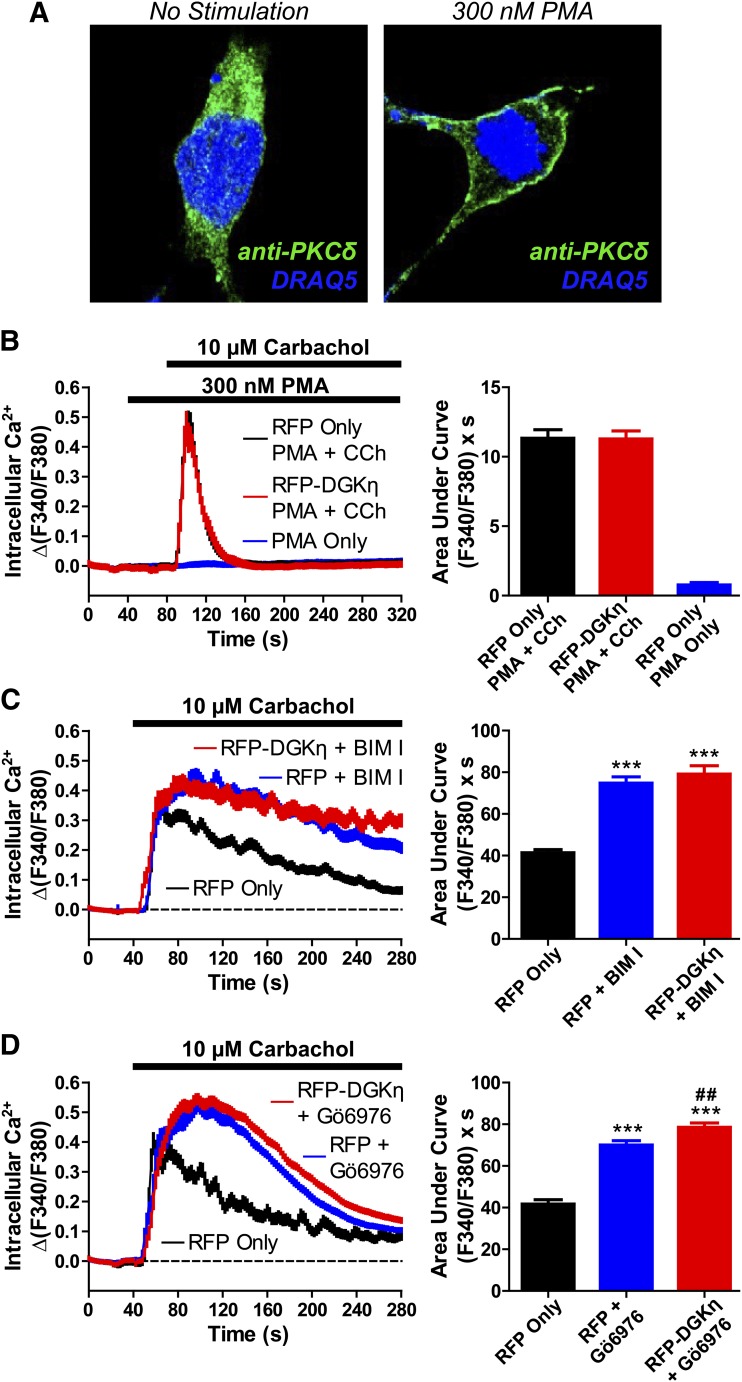
Fig. 6.
DGKη enhances GPCR signaling via PKC. (A) PKCδ translocation following PMA stimulation. Confocal images of HEK293 cells after treatment with (left) vehicle or (right) 300 nM PMA for 2 minutes. Cells were fixed, immunostained with an anti-PKCδ antibody (green), and counterstained with DRAQ5 nuclear dye (blue). (B) Calcium mobilization in HEK293 cells expressing (black, blue) RFP alone or (red) RFP-DGKη after stimulation with (black, red) 300 nM PMA followed by 10 µM carbachol, or (blue) 300 nM PMA alone. AUC measurements extended 80 seconds from final agonist addition. Data are the average of two (PMA alone) or three (PMA + carbachol) independent experiments; n = 49–83 cells per condition. (C and D) Calcium mobilization in HEK293 cells expressing (black, blue) RFP alone or (red) RFP-DGKη after pretreatment with (blue, red) 1 µM PKC inhibitor (C) BIM I or (D) Gö6976. Cells were stimulated with 10 µM carbachol, and AUC measurements extended 4 minutes from agonist addition. Data in C are the average of five independent experiments; n = 140–198 cells per condition. Data in D are the average of three independent experiments; n = 85–148 cells per condition. ***P < 0.001 when compared with RFP in the absence of PKC inhibitor; ##P < 0.01 when compared with RFP plus Gö6976. Unpaired t tests were used to compare data. All data, including calcium traces, are presented as means ± S.E.

