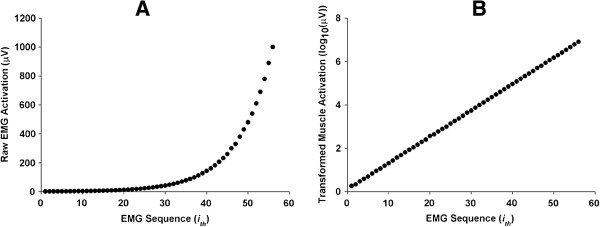
Figure 2.

Distribution of raw muscle activation and transformed muscle activation. Each EMG sequence is a successively higher level than the previous level. A. Raw muscle activation levels (n = 56) provided by microprocessor unit (exponential and heavily skewed). B. Transformed muscle activation levels (n = 56) with log10N (linear).
