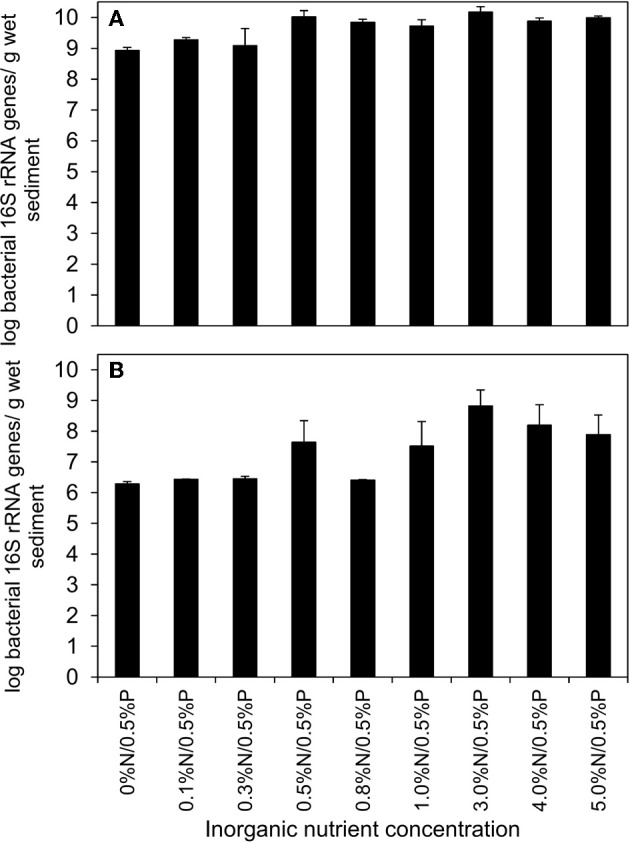
Figure 8.

qPCR analysis of total bacterial 16S rRNA genes (A) and Alcanivorax spp. 16S rRNA genes (B) from crude oil and nutrient treated beach microcosms incubated for 6 days. All microcosms were treated with 0.5% P w/w of oil and the values below the columns indicate the percentage of inorganic N added relative to the mass of oil. Each data point represents average value of three replicates.
