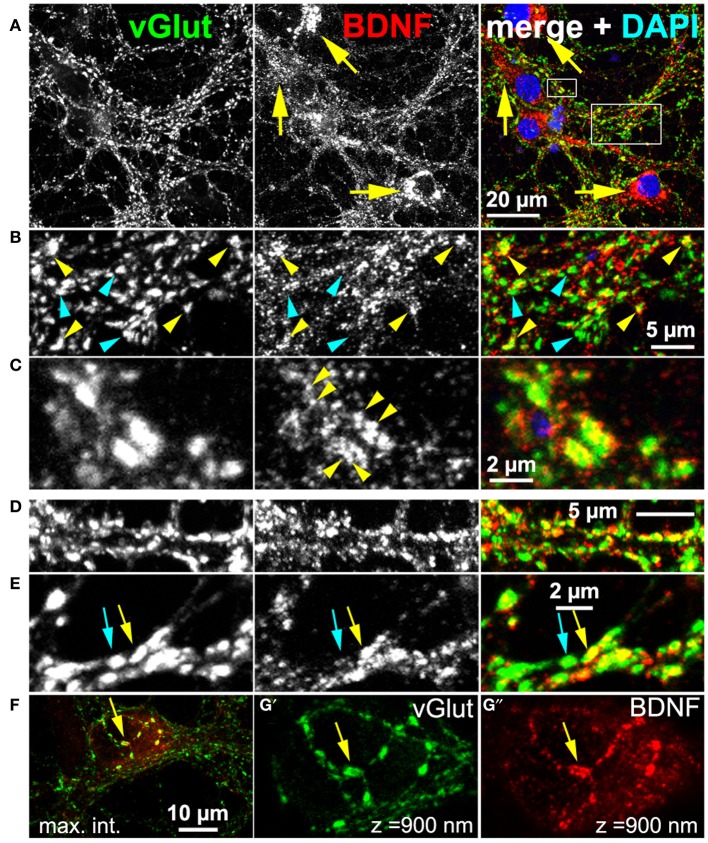
Figure 2.
Endogenous BDNF at glutamatergic synapses (DIV 38). (A–C) Hippocampal neurons with high amounts of BDNF in somatic regions (yellow arrows). (B) (detail of A), BDNF IR was found in close proximity to some (yellow arrowheads), but not all vGlut+ synapses (cyan arrowheads). (C) (detail of A), Single vGlut+ structures exhibited a dense, polymorphic, vesicle-like BDNF signal (yellow arrowheads in middle panel). (D,E) vGlut+/BDNF-rich (yellow arrow) and vGlut+/BDNF-poor synapses (cyan arrow) co-existed in close proximity. (F–G) Neuronal soma with many vGlut+/BDNF-poor synapses in the somatic periphery, innervated by a projection with multiple vGlut+/BDNF-rich synapses (yellow arrow). In (G') and (G”) (detail of F), a confocal stack of 900 nm (maximum intensity projection) from the surface of the somatic region is shown. In (A–C), cell nuclei were labeled with DAPI and are shown in blue.

