Figure 1.
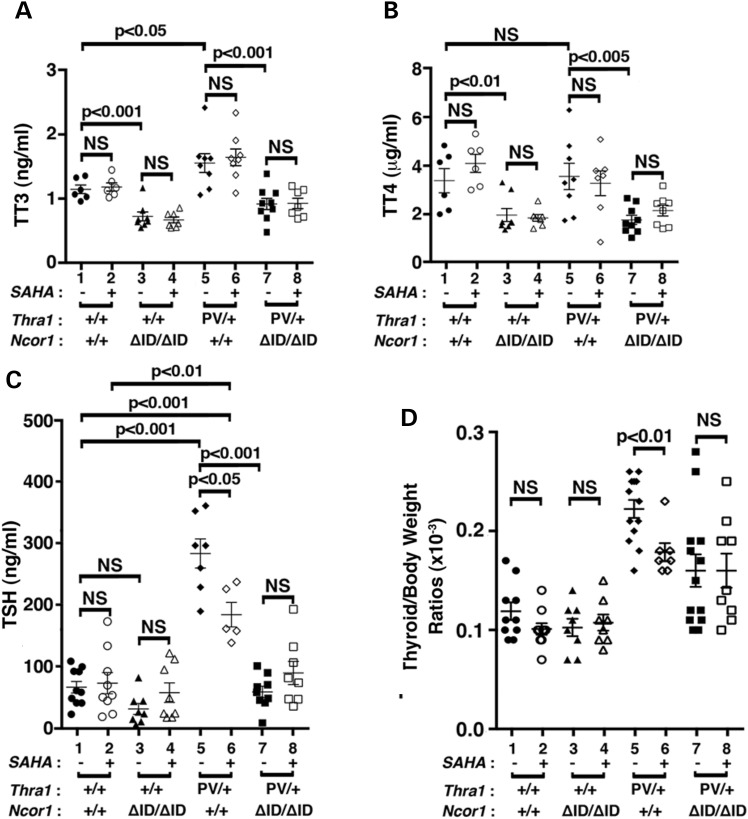
Comparison of thyroid function tests and thyroid weights of Thra1PV/+ and Thra1PV/+Ncor1ΔID/ΔID mice with or without SAHA treatment. Serum levels of total T3 (A) (n = 6–9 mice per group), total T4 (B) (n = 6–9 mice per group), TSH (C) (n = 8–15 mice per group) and thyroid weights (D) were determined in adult mice (3–3.5 months old) as described in Materials and Methods. In (D), ratios of thyroid weight versus body weight were determined. The data are expressed as mean ± SEM with P-values indicated (n = 8–15 mice per group).

