
Figure 2.
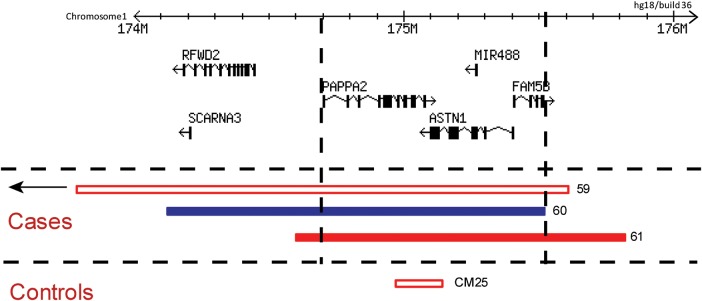
Exonic CNVs found at the ASTN1 locus in clinical and control cohorts. Red and blue bars represent deletions and duplications, respectively, that overlap ASTN1. Empty bars denote CNVs in cases without known NDD phenotypes (from available clinical information) and in controls. Dashed black lines outline the common region of overlap shared among the three CNVs detected in the clinical case dataset. Genomic locations and coordinates are based on hg18 (NCBI36). Information about genes and transcript isoforms was obtained from the RefSeq database.