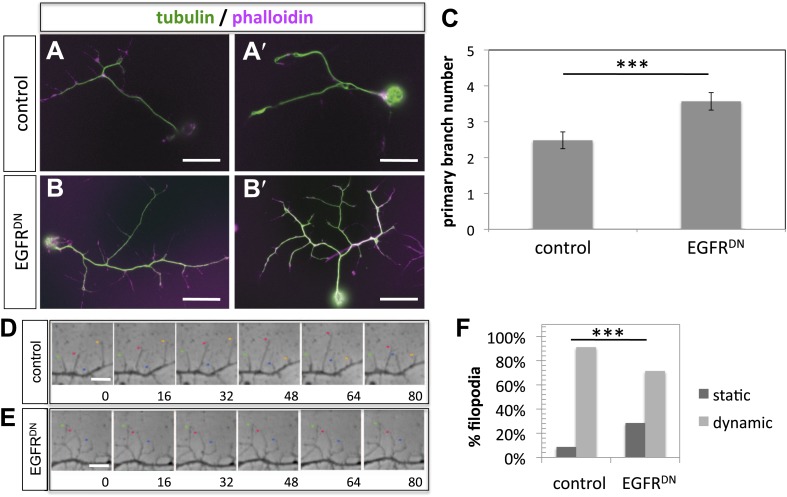
Figure 4. EGFR regulates filopodia dynamics in primary Drosophila neuronal cultures.
(A and B) Branch formation in cultured primary Drosophila neurons (2 days). (B–B′) Overexpression of UAS-EGFRDN using the sca-Gal4 driver results in an increase of branches when compared to (A–A′) wild type (control). For the visualization of branches, neurons were stained with anti-tubulin (green) and phalloidin (magenta). (C) Quantification of primary branch numbers per axon shows significant increase of branches in UAS-EGFRDN neurons (control: 2.48 ± 0.2 (n = 83); EGFRDN: 3.57 ± 0.24; n = 74, p<0.001). (D–E) Still images from videos of (D) wild type and (E) UAS-EGFRDN-expressing neurons. Overexpression of UAS-EGFRDN using the sca-Gal4 driver results in a decrease of filopodia dynamics in primary Drosophila neurons cultured for 6–8 hr. Different filopodia are marked by colored arrows and can be followed over time. (F) Quantification of static vs dynamic (extensions and retractions) behaviors shows a significant distribution change between wild type vs EGFRDN-expressing filopodia (control: static = 10, dynamic = 110; EGFRDN: static = 41, dynamic = 86, p<0.001). Error bars represent SEM. Mann–Whitney test. ***p<0.001. The scale bars in (A–B) represent 10 µm and in (D–E) represent 3 µm.


