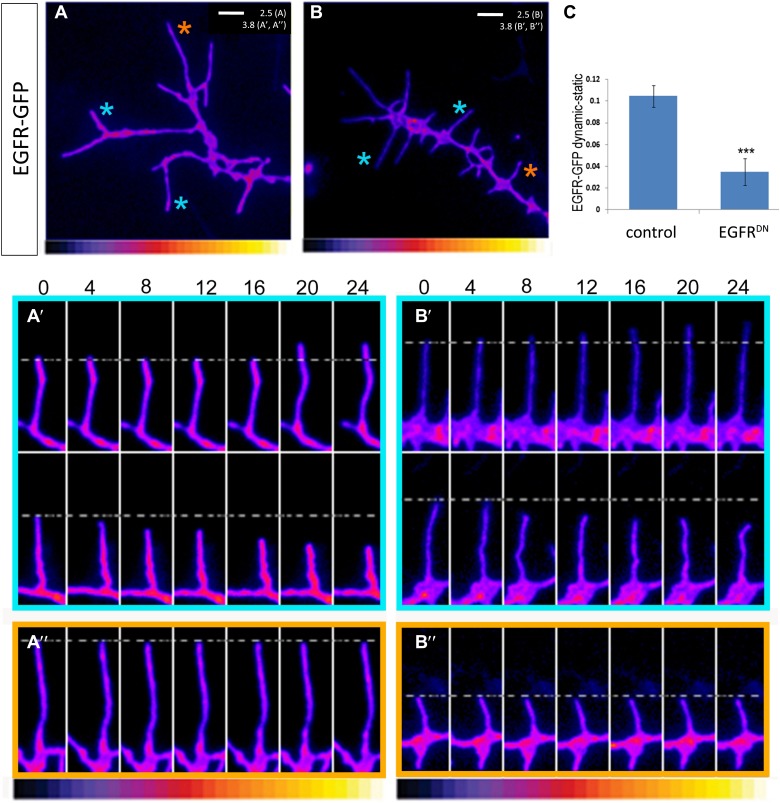
Figure 5. EGFR shows differential localization in filopodia of primary Drosophila neurons.
(A–B) UAS-EGFRGFP expressed with elav-Gal4 in wild type (A) and EGFRDN (B) primary Drosophila neurons. False color image displaying a heat map of an EGFRGFP-expressing growth cone. EGFRGFP expression in dynamic (A′ and B′) and static filopodia (A″ and B″) is followed over time in wild type (A′ and A″) and EGFRDN (B′ and B″). A′ and B′ each shows one filopodia growing and one retracting (C). To quantify EGFRGFP intensity in static vs dynamic filopodia in the absence (control) or presence of EGFRDN, we calculated the ratio of EGFRGFP in dynamic minus static filopodia (GFP maximal intensity of each dynamic phase minus the mean of GFP maximal intensity in static filopodia). The difference in EGFRGFP levels between dynamic filopodia and static filopodia are significantly reduced in the presence of EGFRDN (control dynamic-static: 0.1046 ± 0.009, n=216; EGFRDN dynamic-static: 0.0349 ± 0.0121, n=124, p<0.001). Error bars represent SEM. Mann–-Whitney test. ***p<0.001.


