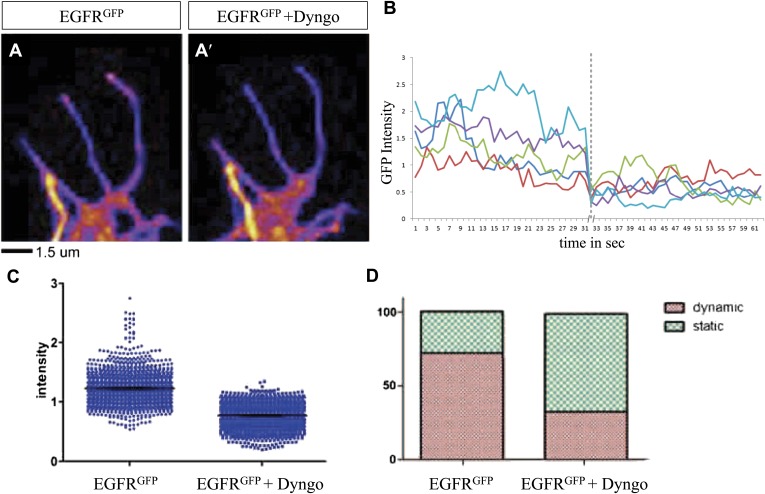
Figure 6. Differential EGFR localization in filopodial of primary Drosophila neurons requires endocytosis.
(A–A′) UAS-EGFRGFP expressed with elav-Gal4 driver in primary Drosophila neurons. False color image displaying a heat map of an EGFRGFP-expressing growth cone before (A) and after (A′) treatment with Dyngo. (B) Maximal intensity of EGFRGFP in filopodia within one neuron over time (2 min), before and after treatment (indicated by dotted line) with Dyngo. (C) Scatter plot from EGFRGFP maximal intensities from filopodia from 6 neurons, showing a significant decrease in levels after treatment with Dyngo (EGFRGFP maximal intensities in DMSO: 1.229 ± 0.0074, n = 1403; EGFRGFP maximal intensities in Dyngo: 0.768 ± 0.005, n = 1401, p<0.001). (D) Effect of Dyngo on filopodia dynamics. Quantification of static vs dynamic (extensions and retractions) behaviors of filopodia shows a significant distribution change between controls (EGFRGFP-expressing neurons in DMSO) and Dyngo-treated EGFRGFP-expressing neurons (control: static = 28, dynamic = 72; Dyngo treated: static = 66, dynamic = 32, p<0.001). Mann–Whitney test. ***p<0.001.

