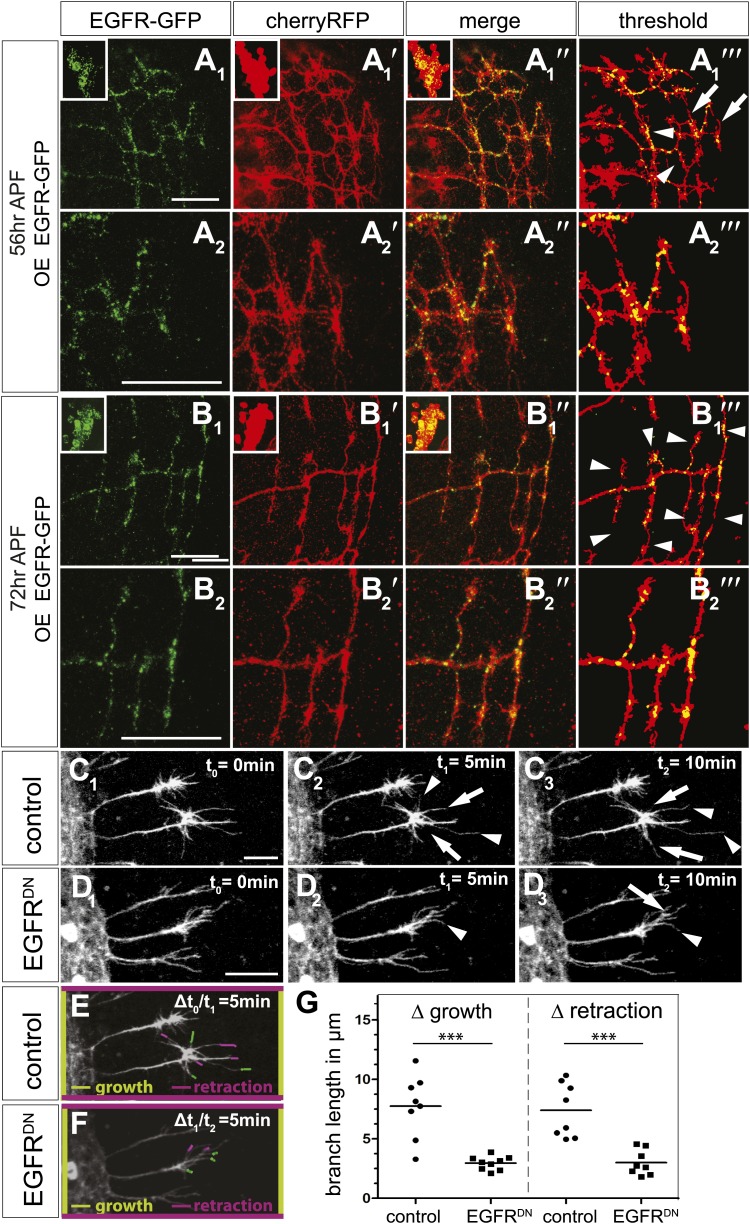
Figure 7. EGFR mediates a probabilistic branch refinement process.
(A–B) EGFR localization examined by expressing UAS-EGFRGFP (green) in the DCNs (red, UAS-cherryRFP) during pupal development at (A) 56 hr APF and (B) 72 hr APF. EGFRGFP expression was observed in a punctate pattern in the cell bodies (insets in A and B) and along the axonal branches (A and B). Images A/B and A′/B′ were subjected to thresholding and merged (A‴/B‴). Differential localization results in branches with (A‴, arrowheads) and without (A‴, arrows) EGFRGFP at 56 hr APF, whereas most if not all branches contain EGFRGFP at 72 hr APF (B‴, arrowheads). High magnification shows EGFR localization at branches at 56 hr APF (A2) and 72 hr APF (B2). (C) Z-stack projections from live imaging time-lapse videos of control axons at around 40 hr APF between t0 = 0 min (C1) and t2 = 10 min (C3) with 5-min intervals. (D) Z-stack projections from live imaging time-lapse videos of EGFRDN axons at around 40 hr APF between t0 = 0 min (D1) and t2 = 10 min (D3) with 5 min intervals. Arrows indicate branches being pruned while arrowheads point to growing branches. (E) Visualization of growth (green) and retraction (purple) events between t0 = 0 min (C1) and t1 = 5 min (C2) in control. (F) Visualization of growth (green) and retraction (purple) events between t1 = 5 min (D2) and t2 = 10 min (D3) in EGFRDN. (G) Quantification of growth and retraction dynamics at branches using the tracer tool shows significant decrease in branch lengths in EGFRDN compared to control. Control (growth) 7.75 ± 2.65 (n = 8), EGFRDN (growth) 2.97 ± 0.56 (n = 9, p<0.001). Control (retraction) 7.4 ± 2.28 (n = 8), EGFRDN (retraction) 3 ± 1.08 (n = 8, p<0.001). Horizontal lines represent the mean for each data set. t test. ***p<0.001. The scale bars represent 20 µm.

