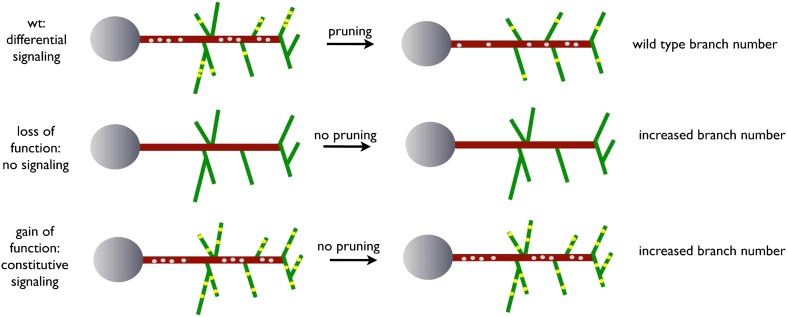
Figure 9. A model for EGFR function in axonal branching.
Local asymmetries in tyrosine kinase receptor activity in axonal branch, driven by differential distribution of active receptor molecules in filopodia, generate dynamical behavior and drive branch pruning. Gray dots represent EGFR puncta trafficked along the axon shaft (red) while yellow dots represent active EGFR puncta within branches (green).

