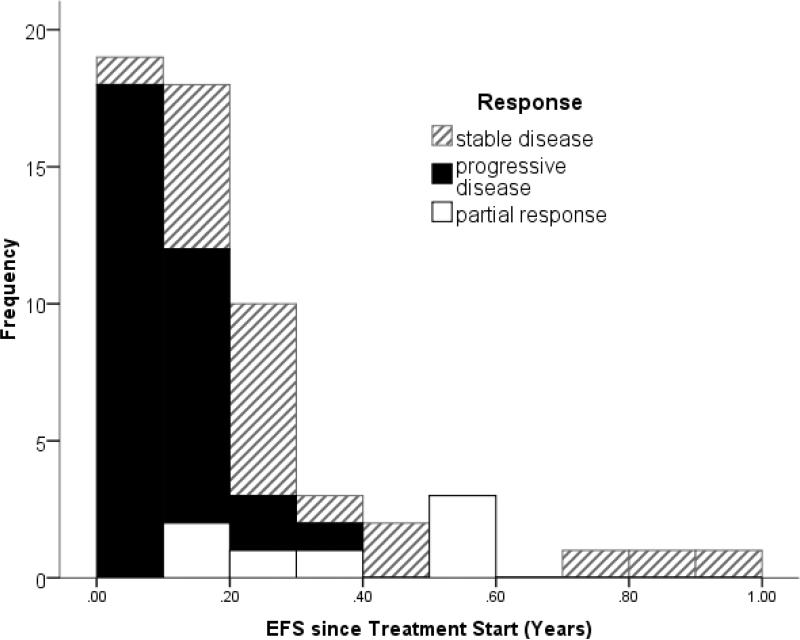
Figure 1.
Progression free survival times in patients treated for recurrent DIPG. The different patterns of the bars indicate if the first evaluation after starting the treatment showed stable disease (hateched) or progressive disease (solid) or partial response (white). Patietns with censored time (event not known yet) are excluded from this figure.

