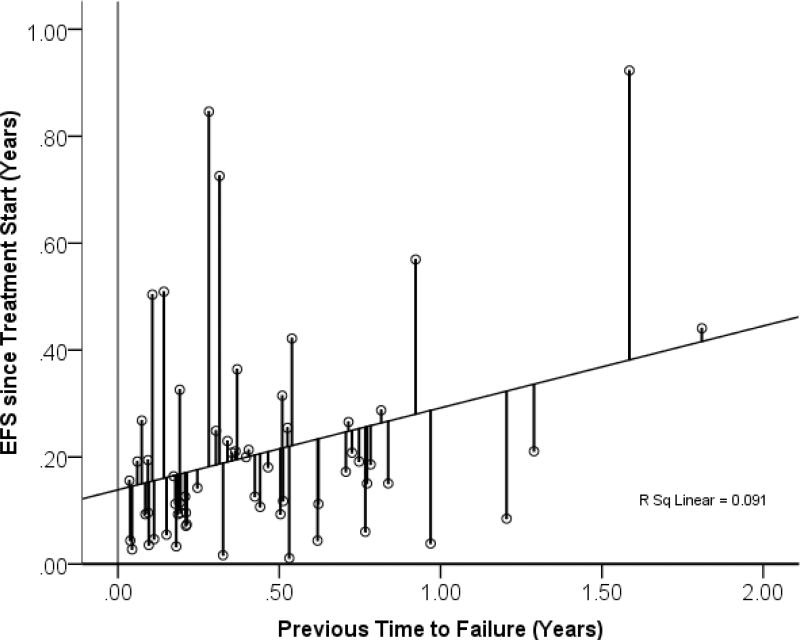
Figure 2.
Event free survival time in recurrent DIPG in relation o previous time to progression in the same patients after the previous treatment attempt. The two number were weakly correlated. The lines indicate the deviation of the observed EFS from the predicted EFS based on the regression analysis. The length of these lines were defined as EFS-gain and used as measure for treatment success. With points far above the regression line suggesting effective treatment., and point below less than average outcomes.

