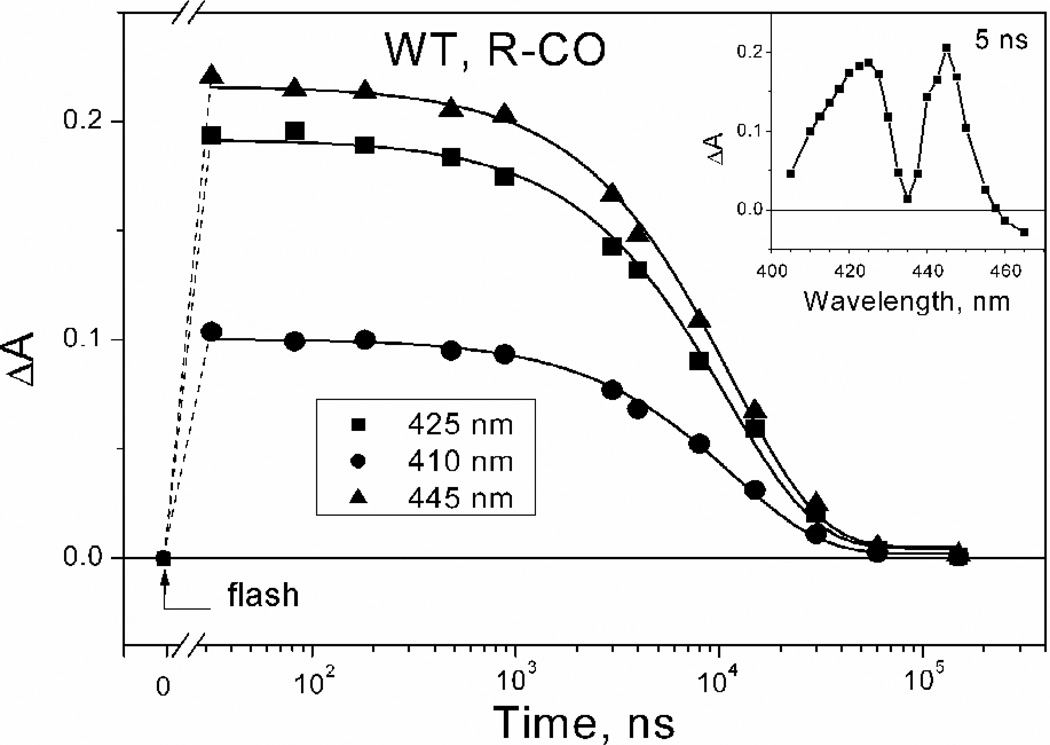
Fig. 1.
Absorption changes measured after photodissociation of CO from the E. coli membranes containing the WT cytochrome bd in the R-CO state. Main panel: Kinetics of absorption changes at selected wavelengths during CO recombination. The kinetic data points (symbols) are shown with their best fits to single exponentials (solid lines) yielding τ ~ 12 µs. Arrow indicates the moment of laser flash. Inset: Transient absorption spectrum at a delay time of 5 ns. For conditions, see the Materials and methods section.

