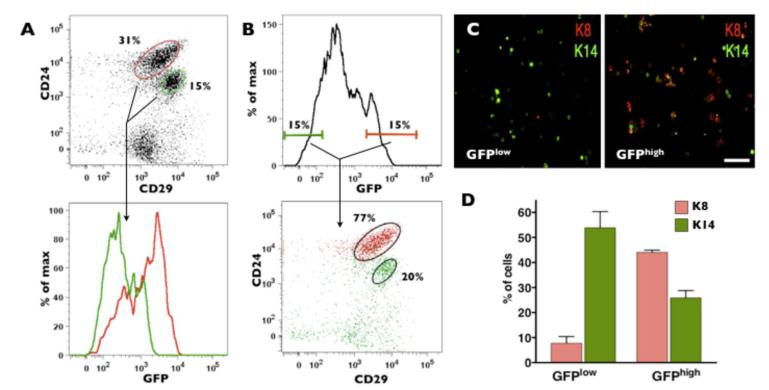
Figure 3. Cells with highest levels of MELK expression include mammary progenitors.
A, flow cytometry analysis of dissociated normal mammary gland revealed up-regulation of GFP signal in CD24+CD29low cells compared to CD24+CD29high cells. B, the GFPhigh cells (top 10-15%) are enriched for cells with progenitor markers. Dot plot and histogram of live Lin− cells (CD45−CD31−TER119−PI−) are shown in the top panels. Cells in the lower panels are color-coded and gated as indicated. C, immunostaining for K8 and K14 demonstrated that GFPhigh cells are enriched for K8 cells, a luminal marker, while GFPlow cells are enriched for K14, a basal marker. Scale bar 50μm. D, quantification of K8 and K14 expression in GFPHigh and GFPLow fractions from MELK-GFP virgin mammary glands. GFPLow and GFPHigh cells express significantly different levels of K8 and K14, p=0.002 and p=0.0164, respectively, n = 3.

